A new issue in Proteomics was recently edited and published by René P. Zahedi et al. regarding proteomics and personalized medicine. This Focus Issue comprises a total of eight valuable contributions from various experts in the field of proteomics research, ranging from methodical development and optimisation to applications dealing with complex samples in biomedical research. Urbani et al. report direct analytical assessment of sample quality for biomarker investigation. They pinpoint the impact of pre-analytical variables that cause major errors in clinical testing. Marko-Varga et al. describe the usage of MALDI imaging as novel tool for personalised diagnostics, as they follow drug action upon treatment of malignant melanoma. Selheim et al. established a novel super-SILAC mix for acute myeloid leukemia (AML) and demonstrate its usage as internal standard for personalized proteomics of AML patients. Jiang et al. demonstrate how SILAC can be utilized to investigate the secretome of activated hepatic stellate cells, the main fibroblast cell type in liver fibrosis. This is an important step for a better understanding of cellular mechanisms during the recovery of liver fibrosis. Borchers et al. introduce novel software for a fast analysis of large datasets derived from crosslinking experiments in order to study protein-protein interactions from large-scale experiments. Gevaert et al. present a technology that allows studying the specificity of methionine sulfoxide reductases and apply it to human samples. The oxidation of free and protein-bound methionine into methionine sulfoxide is a frequently occurring modification caused by reactive oxygen species. This modification may interfere with the identification of posttranslational modification such as protein phosphorylation as well as the peptide identification itself. Mechtler et al. push technology development forward to ultra-low flow nanoHPLC separations. This technology allows obtaining comprehensive proteomic data from less than 100 ng of protein starting material. Finally, Shen et al. demonstrate a rapid and reproducible one-dimensional fast and quantitative LC-MS/MS technology avoiding time- and sample-consuming prefractionation strategies.
↧
Proteomics & personalized medicine Issue in Proteomics
↧
New Release of Spectronaut™ 6.0 from Biognosys
Biognosys releases Spectronaut™ 6.0
Every researcher with access to high-resolution mass spectrometer can now benefit from the Spectronaut™ software September 10, 2014 – Zurich-Schlieren (CH) – Biognosys AG, a Swiss Proteomics Company, announced today the next release of its Spectronaut™ software for analysis of Hyper Reaction Monitoring (HRM) data that will now also be available for industry partners upon request. HRM-MSTM is a targeted proteomics technology developed by Biognosys that enables reproducible and accurate quantification of 1000s of proteins in a single instrument run. HRM is based on data-independent acquisition (DIA or SWATH), which can be performed on most state of the art high-resolution mass spectrometric systems. Founded in 2008 as spin-off from the lab of proteomics pioneer Ruedi Aebersold at ETH Zurich, Biognosys is dedicated to transform life science with superior technology and software.
Contact: info@biognosys.ch, www.biognosys.ch
↧
↧
ProteoWizard: The chosen one in RAW file conversion
 |
| I'm the chosen one. |
File formats (the way that we use to represent, storage and exchange our data) are fundamentals piece in bioinformatics, more than that, are one of the milestone of the Information Era. In some fields the topic is more stable than others, but the topic is still in the table for most of us. To have a quick idea see the evolution of general standards in recent years like XML, JSON and recently YAML.
What happens in computational proteomics? Here a great picture to resume the broad of file formats in Computational proteomics from Eric manuscript in MCP [1]:
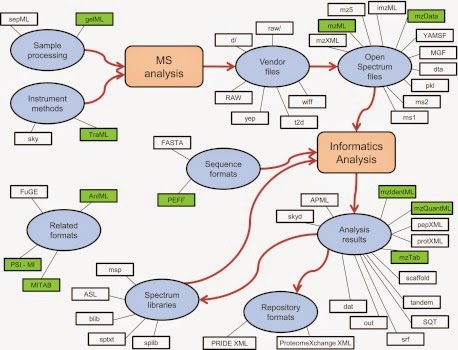
Incredible? In proteomics and mass spectrometry file formats cover a wide range of process, workflows, and analytical protocols divided in to main groups Informatics Analysis and MS Analysis; and the starting point is RAW files (Vendor formats) (I don’t want to explain in details all of these file formats, I’ll dedicate in the near future a post to them). I will talk about RAW Files and why is important to deal with them and who is doing very well the job.
The key to interpreting RAW data directly has been the development of specific software to parse the binary content of these raw files into intelligible data, a tedious and time-consuming task that typically needs to be redone each time a new machine or a new version of an existing machine or its operating software appears [2]. Next to the above-mentioned caveats associated with proprietary raw data formats, there is also the very real problem of “aging” that comes with any binary formatted data. As time goes by, support for certain formats tends to evaporate and within the space of several years, readers can no longer be found for the format.
Then, most of the new softwares and tools in computational proteomics avoid to handle original RAW files and use Standards formats such as: mzXML, mzML or simple peak files. Most of the search engines, quatitation or visualisation tools are based on those files which are more simple to exchange and read. But, who export the original data (RAWs) to those files, the vendors?, No...: PROTEOWIZARD.
![]() Originally published on Bioinformatics in 2008 [3], Proteowizard has played its role for data conversion better than any other tool. ProteoWizard provides a modular and extensible set of open source, cross-platform tools and libraries The framework includes different tools for data conversion and a core API for parsing different data formats [4]. In addition to the open mzML, mzXML, mzIdentML, and mzData XML formats, a variety of proprietary formats can also be handled.
Originally published on Bioinformatics in 2008 [3], Proteowizard has played its role for data conversion better than any other tool. ProteoWizard provides a modular and extensible set of open source, cross-platform tools and libraries The framework includes different tools for data conversion and a core API for parsing different data formats [4]. In addition to the open mzML, mzXML, mzIdentML, and mzData XML formats, a variety of proprietary formats can also be handled.

One of the things I really like from this tool is the simple and modular design which allow the conversion of different proprietary formats to a common data model, see figure about from nature biotechnology paper:
One of the thing still missing in the tool is that to be fully-functional it must be installed and run in a Windows System (Vendors fault). Here (https://github.com/jmchilton/proteowizard-wine-packager) you can find a linux wrapper to run it with wine in a linux machine (didn't tested).
Supported Data Formats
WIFF, T2D (with DataExplorer) | |
MassHunter (.d directories) | |
FID, .d directories, XMASSXML | |
RAW | |
Raw directories | |
mzML | |
mzXML | |
MGF | |
MS2/CMS2/BMS2 | |
mz5 |
Other tools?
- ms2mz by bioproximity: simple utility for converting between common mass spectrometer file formats.
- APLToMGFConverter: converts MaxQuant APL (Andromeda peak lists) to MGF.
- CompassXport: converts Bruker analysis.baf and analysis.yep files to mzXML.
- dat2mgf: converts Mascot results files back to MGF
- DataAnalysis2TPP: converts MGF from Bruker DataAnalysis to TPP-friendly format for use with XPRESS and ASAPRatio
- MassWolf: converts MassLynx format to mzXML
- MGF to .dta File Converter: converts MGF to .dta
- mz2mgf: converts mzData files to MGF
- mzBruker: converts Bruker analysis.baf files to mzXML
- mzStar: converts SCIEX/ABI Analyst format (WIFF) to mzXML
- mzXML2Other: converts mzXML to SEQUEST .dta, MGF, and Micromass .pkl
- PklFileMerger: merges individual Q-TOF .pkl files into a single file for database searching.
- ReAdW: converts Xcalibur native acquisition files to mzXML
- T2D converter: converts ABI SCIEX 4700/4800 t2d files to mzXML
- unfinnigan: reading Thermo .raw files without MsFileReader
- wiff2dta: converts ABI WIFF to .dta
- X2XML: converts from almost any format (Thermo, Bruker, Agilent and Micromass) to mzXML
References
[1] Deutsch, Eric W. "File formats commonly used in mass spectrometry proteomics." Molecular & Cellular Proteomics 11.12 (2012): 1612-1621.
[2] Martens, Lennart, et al. "Do we want our data raw? Including binary mass spectrometry data in public proteomics data repositories." Proteomics 5.13 (2005): 3501-3505.
[3] Kessner, Darren, et al. "ProteoWizard: open source software for rapid proteomics tools development." Bioinformatics 24.21 (2008): 2534-2536.
[4] Perez-Riverol, Yasset, et al. "Open source libraries and frameworks for mass spectrometry based proteomics: A developer's perspective." Biochimica et Biophysica Acta (BBA)-Proteins and Proteomics 1844.1 (2014): 63-76.
↧
Installing standalone SpectraST in linux
Some tips to install SpectraST in linux in standalone:
1. - Download TTP latest version.
2. - go to SpectraST folder and run make:
cd TPP-x.x.x/trans_proteomic_
make -f Makefile_STANDALONE_LINUX
If you have some problems with dependencies this tips should help:
Reproduce:
1. - Download TTP latest version.
2. - go to SpectraST folder and run make:
cd TPP-x.x.x/trans_proteomic_
make -f Makefile_STANDALONE_LINUX
If you have some problems with dependencies this tips should help:
I successfully installed the standalone version of SpectraST on an Ubuntu machine, but I had to make the two following changes. Perhaps these changes could be made to the prerequisites script and the source, respectively. Details below.
1. install libgsl0-dev from apt-get
2. modify SpectraST_util.cpp to include unistd.h
As for the first, I understand that the prerequisites scripts don't include Ubuntu 13.04. Perhaps the second issue is also specific to later ubuntu versions.
Ubuntu 13.04, 64-bit
TPP 4.6.3
1. gsl dependency
Reproduce:
$ cd TPP-4.6.3/trans_proteomic_pipeline/src/Search/SpectraST $ make -f Makefile_STANDALONE_LINUX...g++ -I/usr/include -Werror -Wformat -Wstrict-aliasing -Wno-deprecated -Wno-char-subscripts -D_FILE_OFFSET_BITS=64 -D_LARGEFILE_SOURCE -DSTANDALONE_LINUX -I/usr/include -D_FILE_OFFSET_BITS=64 -D_LARGEFILE_SOURCE -Werror -Wformat -Wstrict-aliasing -Wno-deprecated -Wno-char-subscripts -O2 -c SpectraSTDenoiser.cpp -o linux_standalone/SpectraSTDenoiser.o SpectraSTDenoiser.cpp:8:28: fatal error: gsl/gsl_vector.h: No such file or directorycompilation terminated.make: *** [linux_standalone/SpectraSTDenoiser.o] Error 1
Fix:
$ sudo apt-get install libgsl0-dev
2. unistd.h (getcwd)
$ make -f Makefile_STANDALONE_LINUX
...
g++ -I/usr/include -Werror -Wformat -Wstrict-aliasing -Wno-deprecated -Wno-char-subscripts -D_FILE_OFFSET_BITS=64 -D_LARGEFILE_SOURCE -DSTANDALONE_LINUX -I/usr/include -D_FILE_OFFSET_BITS=64 -D_LARGEFILE_SOURCE -Werror -Wformat -Wstrict-aliasing -Wno-deprecated -Wno-char-subscripts -O2 -c SpectraST_util.cpp -o linux_standalone/SpectraST_util.o SpectraST_util.cpp: In function ‘char* safepath_getcwd(char*, int)’:SpectraST_util.cpp:587:30: error: ‘getcwd’ was not declared in this scopemake: *** [linux_standalone/SpectraST_util.o] Error 1
Fix:
Change the relevant lines in SpectraST_util.cpp:
#ifdef _MSC_VER // if under Visual Studio#include <direct.h> // for getcwd#else#include <unistd.h>#endif
↧
Who is a senior developer anyway?
Who is a senior developer anyway?
What makes you a “senior developer”? Everyone and their dog calls themselves a senior developer these days. From fresh graduates to the CTO, everyone is a senior developer. But what the hell does it even mean?
Technologists
Some developers are avid technologists. They got into programming really because they like tinkering. If it hadn’t been 7 languages in 7 weeks, it would have been a box of meccano or they’d be in their shed busy inventing the battery operated self-tieing tie. These people are great to have on your team, they’ll be the ones continually bombarding you with the latest and greatest shiny. If you ever want to know if there’s an off the shelf solution to your problem, they’ll know the options, have tried two of them, and currently have a modified version of a third running on their raspberry pi.
The trouble with technologists is more technology is always the answer. Why have a HTTP listener when you can have a full stack application server? Why use plain old TCP when you can introduce an asynchronous messaging backbone? Why bother trying to deliver software when there’s all these toys to play with!
Toolsmiths
Some developers naturally gravitate towards providing tools for the rest of the developers on the team. Not for them the humdrum world of building some boring commercial website, instead they’ll build a massively flexible website creation framework that through the magic of code generation will immediately fill source control with a gazillion lines of unmaintainable garbage. Of course, that’s assuming it works, or that they even finish it – which is never guaranteed.
There’s a certain kudos to being the tools guy on the team: you don’t want the most junior member of the team creating tools that everyone else uses. If he screws up, his screw up will be amplified by the size of the team. Instead one of the smart developers will see a problem and start sharpening his tools; the trouble is you can spend an awful long time creating really sharp shears and somehow never get round to shaving the yak.
Backend Boys (and Girls)
Another common pull for a lot of developers is to get further down the stack, away from those messy, annoying users and nearer to the data. Here you can make problems more pure, really express your true artistry as a developer and an architect. It’s true: as you move down the stack you tend to find the real architectural meat of a system, where you want the developers who can see the big picture of how everything interacts. The seasoned professionals that understand scalability, availability and job-security.
It’s pretty easy to put off outsiders (project managers, customers, sniveling little front end developers) – you start drawing diagrams with lots of boxes and talk of enterprise grade messaging middleware and HATEOAS service infrastructure, before you know it their eyes have glazed over and they’ve forgotten what they were going to ask you: like perhaps why this has taken six months to build instead of six days?
GTD
Some developers just Get Things Done. Sure their methods might be a little… slapdash. But when you’re in a crunch (when aren’t you?) and you need something done yesterday, these are the people you want on your team. They won’t waste time designing a big complex architecture; they won’t even waste time writing automated tests. They’ll just hammer out some code and boom! problem solved.
Sometimes they can come across as heroes: they love nothing better than wading into a tough battle to show how fast they can turn things around. Of course, that also lets them quickly move from battlefield to battlefield, leaving others to clean up the dead and wounded they’ve left behind.
Front End Developers
For some reason Front End developers never seem to be considered the most senior. As though hacking WPF or HTML/CSS was somehow less worthy. In fact, I think the front end is the most important part – it’s where all your wonderful n-tier architecture and multiple redundant geegaws finally meets users. And without users, everything else is just intellectual masturbation.
The front end developers are responsible for the user experience. If they make a mess, the product looks like crap, works like crap: it’s crap. But if the front end developers create a compelling, easy to use application – it’s the great, scalable architecture underneath that made it all possible. Obviously.
Team Lead
Your team lead probably isn’t a senior developer. Sorry, bro: if you’re not coding you can’t call yourself anything developer. Go easy on your team lead though: the poor sod probably wrote code once. He probably enjoyed it, too. Then some suit decided that because he was good at one job, he should stop doing that and instead spend his life in meetings, explaining to people in suits why the product he’s not writing code for is late.
Architect
Your architect probably isn’t a senior developer either. Unless he’s actually writing code. In which case, why does he need the label “architect”? Architecture is a team responsibility. Sure, the most senior guy on the team is likely to have loads of experience and opinions to share with the team – but it doesn’t mean his pronouncements should be followed like scripture. But if instead of writing code you spend your time drawing pretty pictures of your scalable messaging middleware one more time, I will shove it up your enterprise service bus.
Conclusion
There are lots of different types of senior developer. That’s probably why the term has got so devalued. Once you’ve been in the industry for a few years, you’ll have found yourself in at least one of these roles and can immediately call yourself senior. The truth is you spend your whole life learning, only in an industry this young and naive could someone with 3 years experience be called “senior”. I’ve been programming professionally for 13 years and I’m only just starting to think I’m getting my head around it. I’m sure next year I’ll realise I’m an idiot and there’s a whole new level to learn.
So, go ahead, call yourself senior developer. Just make sure you keep on learning. Change jobs, wear a different hat. Be the tools guy. Meet like-minded developers. Play with different technologies. Become a middle tier developer. Then switch to work on user experience.
Senior developer: it’s just a job title, after all.
↧
↧
Analysis of histone modifications with PEAKS 7: A respond to Search Engines comparison from PEAKs Team
Recently we posted a comparison of different search engines for PTMs studies (Evaluation of Proteomic Search Engines for PTMs Identification). After some discussion of the mentioned results in our post the PEAKS Team just published a blog post with the reanalysis of the dataset. Here the results:
Originally Posted in Peaks Blog:
The complex nature of histone modification patterns has posed as a challenge for bioinformatics analysis over the years. Yuan et al. [1] conducted a study using two datasets from human HeLa histone samples, to benchmark the performance of current proteomic search engines. This article was published in J Proteome Res. 2014 Aug 28 (PubMed), and the data from the two datasets, HCD_Histone and CID_Histone (PXD001118), was made publically available through ProteomeXchange. With this data, the article uses eight different proteomic search engines to compare and evaluate the performance and capability of each. The evaluated search engines in this study are: pFind, Mascot, SEQUEST, ProteinPilot, PEAKS 6, OMSSA, TPP and MaxQuant.
In this study, PEAKS 6 was used to compare the performance capabilities between search engines. However, PEAKS 7, which was released November 2013, is the latest version available of the PEAKS Studio software. PEAKS 7 not only includes better performance than PEAKS 6, but a lot of additional and improved features. Our team has reanalyzed the two datasets HCD_Histone and CID_Histone with PEAKS 7 to update the ID results presented in the publication by Yuan et al. These updated results showed that instead, it is PEAKS, pFind and Mascot that identify the most confident results.
Proportion of Confident IDs
As indicated in the article, the two HeLa histone datasets were examined by each search engine using the same database search parameters. Seven variable modifications of histone were used in the study, and are reiterated in table 1 below.
Table 1. Modification parameters for database search
Fixed modification | Propionyl[Peptide N-term]/+56.02 | |
Variable modification | First (un) | Propionyl[K]/+56.026 |
Second (ac) | Propionyl[K]/+56.026; Acetyl[K]/+42.011 | |
Third (me) | Propionyl[K]/+56.026; Methyl_Propionyl[K]/+70.042 | |
Fourth (di) | Propionyl[K]/+56.026; Dimethyl[K]/+28.031 | |
Fifth (tr) | Propionyl[K]/+56.026; Trimethyl[K]/+42.047 | |
Sixth (ph) | Propionyl[K]/+56.026; Phospho[ST]/+79.966 | |
Seventh (co) | Propionyl[K]/+56.026; Acetyl[K]/+42.011; Methyl_Propionyl[K]/+70.042; Dimethyl[K]/+28.031; Trimethyl[K]/+42.047; Phospho[ST]/+79.966 | |
When the data was run with PEAKS 7 also using these same parameters, an updated comparison of the IDs and confident IDs from the article published by Yuan et al. was created, as shown in figure 1. The comparison includes the results produced by the eight different search engines. IDs (shown as solid bars) from each search engine are identifications with an FDR < 1%; whereas confident IDs (shown as striped bars) are the number of IDs from each search engine which are also present in the ‘all_Confident’ group of IDs. The term ‘all_Confident’ was used to indicate IDs that were found by at least two of the eight different search engines.
![]()
References

Figure 1 (a-g). Comparison of the number of IDs and confident IDs of the seven variable modifications produced by the different search engines using HeLa histone HCD and CID data |
(a) indicates the number of first (un) modified ID; (b) number of second (ac) modified ID; (c) number of third (me) modified ID; (d) number of fourth (di) modified ID; (e) number of fifth (tr) modified ID; (f) number of sixth (ph) modified ID; and (g) number of seventh (co) modified ID. |
By analyzing each of the graphs presented in figure 1, PEAKS 7 produces the most confident results of the search engines evaluated in the study, along with pFind and Mascot. This is true in all cases (un, ac, di, tr, ph, and co; where ph tied with pFind and Mascot, and cotied for first with Mascot) except in the third modification where pFind and Mascot found the most confident result.
Running Time
For this analysis, PEAKS 7 was run on a typical desktop computer with an i7 CPU and 16G RAM. PEAKS 7 finished each of the first six searches (un, ac, me, di, tr, and ph) around 22 minutes and then 14 minutes for the HCD_Histone and CID_Histone database searches respectively. Compared to 2h-7h indicated by [1] using PEAKS 6, the speed of PEAKS 7 is much faster. For the seventh search which involved multiple PTMs (co), PEAKS spent 30 minutes, and then 14 minutes performing the database search for HCD_Histone and CID_Histone respectively.
Therefore, the performance time of PEAKS 7 is very comparable to the other search engines as drawn in conclusion from [1] and consistent with the performance capabilities presented in (http://peaksblog.bioinfor.com/2013/12/boost-your-analysis-speed-with-peaks-7.html).
Therefore, the performance time of PEAKS 7 is very comparable to the other search engines as drawn in conclusion from [1] and consistent with the performance capabilities presented in (http://peaksblog.bioinfor.com/2013/12/boost-your-analysis-speed-with-peaks-7.html).
References
1. Yuan ZF, Lin S, Molden RC, Garcia BA. Evaluation of proteomic search engines for the analysis of histone modifications. J Proteome Res. 2014 Aug 28. [Epub ahead of print]
↧
Which journals release more public proteomics data!!!
I'm a big fan of data and the -omics family. Also, I like the idea of make more & more our data public available for others, not only for reuse, but also to guarantee the reproducibility and quality assessment of the results (Making proteomics data accessible and reusable: Current state of proteomics databases and repositories). I'm wondering which of these journals (list - http://scholar.google.co.uk/) encourages their submitters and authors to make their data publicly available:
Journal | h5-index | h5-median |
Molecular & Cellular Proteomics | 74 | 101 |
Journal of Proteome Research | 70 | 91 |
Proteomics | 60 | 76 |
Biochimica et Biophysica Acta (BBA)-Proteins and Proteomics | 52 | 78 |
Journal of Proteomics | 49 | 60 |
Proteomics - Clinical Applications | 35 | 43 |
Proteome Science | 23 | 32 |
After a simple statistic, based on PRIDE data:
 |
| Number of PRIDE projects by Journal |
The final list:
Mol Cell Proteomics | 88 |
J Proteome Res | 71 |
Proteomics | 51 |
PLoS One | 25 |
J Proteomics | 13 |
Nat Commun | 12 |
BMC Microbiol | 6 |
Proc Natl Acad Sci U S A | 6 |
Anal Chem | 5 |
Cell Rep | 5 |
Nature | 4 |
Antioxid Redox Signal | 3 |
Electrophoresis | 3 |
Front Microbiol | 3 |
Biol Reprod | 2 |
BMC Biol | 2 |
BMC Genomics | 2 |
Cell Commun Signal | 2 |
Clin Proteomics | 2 |
Elife | 2 |
EMBO J | 2 |
Fungal Genet Biol | 2 |
Genome Biol | 2 |
J Am Soc Nephrol | 2 |
J Immunol | 2 |
Mol Syst Biol | 2 |
Nucleic Acids Res | 2 |
PLoS Genet | 2 |
Sci Signal | 2 |
BMC Syst Biol | 2 |
Electrophoresis | 2 |
Science | 2 |
Mol Cell Biol | 2 |
Proteome Sci | 2 |
Plos One the open access peer-reviewed scientific journal published by the Public Library of Science (PLOS) is one of the big contributors to PRIDE and ProteomeXchange. This fact can be related with the type of authors submitting papers to Plos One. Plos One philosophy is be as more open and possible and most of the authors know how to make visible their manuscript data. Molecular Cell Proteomics , Journal of Proteome Research and Proteomics have encouraged the authors to make public their data for years. In contrast other journals more close to the proteomics topic are far from the top like Analytical Chemistry, Electrophoresis or Proteome Science.
More interesting than that, more than 700 projects in PRIDE do not have a publication behind. It means that the community enjoy the idea of make public their data to be reuse, analyse and inspect by others. Data sharing in proteomics is now a mature field [1], authors know from other fields like software development and the open-source movement [2] that they can advance and progress more if they share. Hopefully in the near future we will see in every proteomics journal a box asking if you made your data public and requesting the url.
More interesting than that, more than 700 projects in PRIDE do not have a publication behind. It means that the community enjoy the idea of make public their data to be reuse, analyse and inspect by others. Data sharing in proteomics is now a mature field [1], authors know from other fields like software development and the open-source movement [2] that they can advance and progress more if they share. Hopefully in the near future we will see in every proteomics journal a box asking if you made your data public and requesting the url.
[1] Perez-Riverol Y. et al. Making proteomics data accessible and reusable: Current state of proteomics databases and repositories. Proteomics. 2014 Aug 26. doi: 10.1002/pmic.201400302. [Epub ahead of print]
[2] Perez-Riverol Y et al. Open source libraries and frameworks for mass spectrometry based proteomics: a developer's perspective. Biochim Biophys Acta. 2014 Jan;1844(1 Pt A):63-76. doi: 10.1016/j.bbapap.2013.02.032. Epub 2013 Mar 1.
↧
Ontologies versus controlled vocabularies.
While the minimum data standards describe the types of data elements to be captured, the use of standard vocabularies as values to populate the information about these data elements is also important to support interoperability. In many cases, groups develop term lists (controlled vocabularies) that describe what kinds of words and word phrases should be used to describe the values for a given data element. In the ideal case each term is accompanied by a textual definition that describes what the term means in order to support consistency in term use. However, many bioinformaticians have begun to develop and adopt ontologies that can serve in place of vocabularies for use as these allowed term lists. As with a specific vocabulary, an ontology is a domain-specific dictionary of terms and definitions. But an ontology also captures the semantic relationships between the terms, thus allowing logical inferencing about the entities represented by the ontology and by the data annotated using the ontology’s terms.
The semantic relationships incorporated into the ontology represent universal relations between the classes represented by its terms based on knowledge about the entities described by the terms established previously. An ontology is a representation of universals; it described what is general in reality, not what is particular. Thus, ontologies describe classes of entities whereas databases tend to describe instances of entities.
The Open Biomedical Ontology (OBO) library was established in 2001 as a repository of ontologies developed for use by the biomedical research community (http://sourceforge.net/projects/obo). In some cases, the ontology is composed of a highly focused set of terms to support the data annotation needs of a specific model organism community (e.g. the Plasmodium Life Cycle Ontology). In other cases, the ontology covers a broader set of terms that is intended to provide comprehensive coverage of an entire life science domain (e.g. the Cell Type Ontology). The European Bioinformatics Institute has also developed the Ontology Lookup Service (OLS) that provides a web service interface to query multiple OBO ontologies from a single location with a unified output format (http://www.ebi.ac.uk/ontology-lookup/). Both the BioPortal and the OLS permit users to browse individual ontologies and search for terms across ontologies according to term name and certain associated attributes.
↧
What is BioHackathon 2014?
In a week BioHackathon 2014 will start (http://www.biohackathon.org/). It will be my first time ins this kind of "meeting". I will give a talk about PRIDE and ProteomeXchange and future developments of both platforms (below the complete list of talks).
But first, a quick introduction of BioHackathon. National Bioscience Database Center (NBDC) and Database Center for Life Science (DBCLS) have been organizing annual BioHackathon since 2008, mainly focusing on standardization (ontologies, controlled vocabularies, metadata) and interoperability of bioinformatics data and web services for improving integration (semantic web, web services, data integration), preservation and utilization of databases in life sciences. This year, we will focus on the standardization and utilization of human genome information with Semantic Web technologies in addition to our previous efforts on semantic interoperability and standardization of bioinformatics data and Web services.
BioHackathon 2014 will be focus in these topics:
In addition to the efforts in the past BioHackathons including development of tools, ontologies, RDF data and accumulation of best practices, we will focus on the standardization and utilization of human genome information:
- Topics may cover the following domains, but are not limited to:
- Standardization of RDF data and development of tools/ontologies
- Human genome/variation and medical information
- Animal, plant and microbial genomes
- Ortholog/phylogenomic databases
- Proteomics, metabolomics, glycomics etc.
- Text-mining and ontology mapping
- Documentation and visualization of RDF model
- URI transformation and mapping for interlinking resources
- Quality assessment of SPARQL endpoints
- Applications based on Linked Open Data
- Natural language processing and QA system
- Utilization of TogoStanza, TogoTable etc.
Biohackaton Symosium:
8:30 Meet up at the hotel lobby
9:00 Registration opens
10:00 Introduction from organizers
10:00-10:05Welcome address
10:05-10:20Introduction to the NBDC/DBCLS BioHackathon 2014 (Toshiaki Katayama)
10:20-10:40Introduction to the Tohoku Medical Megabank Organization (Masao Nagasaki Tohoku Medical Megabank Organization)
10:40-11:00Integrated database and triplestore in prospective cohort study at the Tokyo Medical Megabank Project (Soichi Ogishima Tohoku Medical Megabank Organization, Japan)
11:00 Coffee break
11:20 Invited talks
11:20-11:40Embracing Semantic Web Technologies at the European Bioinformatics Institute (Simon Jupp European Bioinformatics Institute, UK)
11:40-12:00Identifiers.org: new services to support the Semantic Web community (Sarala Wimalaratne European Bioinformatics Institute, UK)
12:00-12:20Introduction to BioJS (Leyla Jael Garcia Castro European Bioinformatics Institute, UK)
12:20 Lunch
13:30 Invited talks
13:30-13:45Construction of ortholog database using the Semantic Web technology (Hirokazu Chiba National Institute for Basic Biology, Japan)
13:45-14:00Semantic integration of orthology resources: beyond the OGO experience (Jesualdo Thomas Fernandez Breis University of Murcia, Spain)
14:00-14:20Text mining for ontology learning and matching (Jung-Jae Kim Nanyang Technological University, Singapore)
14:20 Coffee break
14:40 Invited talks
14:40-15:00Rhea: a reactions database linking biology and chemistry (Thierry Lombardot Swiss Institute of Bioinformatics, Switzerland)
15:00-15:20PRIDE and ProteomeXchange – Making proteomics data accessible and reusable (Yasset Perez-Riverol European Bioinformatics Institute, UK)
15:20-15:40PubChemRDF: Towards a semantic (web) description of PubChem (Evan Bolton National Center for Biotechnology Information, US)
15:40-16:00Challenges and Solutions for Data Integrity in Linked Data Systems (Robert Buels Foundation Medicine, US)
16:00 Group photo
16:30 ToMMo tour
17:00 Bus to the hackathon venue
19:00 Reception party
↧
↧
QC metrics into Progenesis QI for proteomics
Originally posted NonLinear
Proteomics as a field is rapidly maturing; there is a real sense that established techniques are being improved, and excitement at emerging techniques for quantitation. Central to this revolution is the application of effective quality control (QC) – understanding what adversely affects proteomics data, monitoring for problems, and being able to pin down and address them when they arise.
We’ve been at the forefront of QC implementation over the years, from our early involvement in the Fixing Proteomics campaign to our staff (in a previous guise!) publishing on proteomics QC[1], and it’s an area that’s very important to us – we want you to have confidence in your data and your results, as well as our software.
For that reason we’re making the application of QC easier, by introducing automatic QC metrics into Progenesis QI for proteomics. These constitute a range of charts that present your LC-MS data in an easy to visualise way, summarising key experimental statistics and allowing you to check for any batch-to-batch and run-to-run variation in your processing. We’re really digging in to the data; you can examine overview charts for the whole experiment and also detailed ones focussing in at the run level.

If you’d like to get a flavour of the comprehensive range of metrics we’re offering, have a look at the FAQ page. They range from overview metrics including abundance dynamic range, summaries of identifications obtained and precursor mass errors, and missed cleavages, to detailed run monitoring including MS1 scan rates. We’ve also included a chart detailing the level of overlap between your conditions in Venn diagram format.

You’ll see these charts at the QC Metrics page after you initially run an analysis using the auto-processing wizard so that you’ll get an immediate flavour of your data, and you can also visit the QC Metrics page in the workflow at any time – the charts update with changes you make, so that you can both evaluate your data quality, and also the choices you’ve made as you have processed it. They’ll also re-plot the data as you change your experimental design so you can investigate any variable you like, and you can flag up particular charts with comments or export them as a QC report. You can also add new runs to an existing experiment to measure the metrics over an extended period.
The intention is that QC Metrics will provide you with a versatile and simple aid for process optimisation, troubleshooting and quality assurance. We think this should be a very useful addition to the software, and we’re always interested in feedback on developing this further – please have a look and let us know what you think!
[1] Jackson, D. and Bramwell, D., 2013: “Application of clinical assay quality control (QC) to multivariate proteomics data: a workflow exemplified by 2-DE QC.” J Proteomics 95: 22-37.
↧
PRIDE and ProteomeXchange – Making proteomics data accessible and reusable
Slides Presentation:
Youtube Presentation:
↧
HUPO-PSI Meeting 2014: Rookie’s Notes
 |
| Standardisation: the most difficult flower to grow. |
The PSI (Proteomics Standard Initiative) 2014 Meeting was held this year in Frankfurt (13-17 of April) and I can say I’m now part of this history. First, I will try to describe with a couple of sentences (for sure I will fai) the incredible venue, the Schloss Reinhartshausen Kempinski. When I saw for the first time the hotel, first thing came to my mind was those films from the 50s. Everything was elegant, classic, sophisticated - from the decoration to a small latch. The food was incredible and the service is first class from the moment you set foot on the front step and throughout the whole stay.
Standardization is the process of developing and implementing technical standards. Standardization can help to maximize compatibility, interoperability, safety, repeatability, or quality. It can also facilitate commoditization of formerly custom processes. In bioinformatics, the standardization of file formats, vocabulary, and resources is a job that all of us appreciate but for several reasons nobody wants to do. First of all, standardization in bioinformatics means that you need to organize and merge different experimental and in-silico pipelines to have a common way to represent the information. In proteomics for example, you can use different sample preparation, combined with different fractionation techniques and different mass spectrometers; and finally using different search engines and post-processing tools. The diversity and possible combinations is needed because allow to explore different solutions for complex problems. (Standarization in Proteomics: From raw data to metadata files).
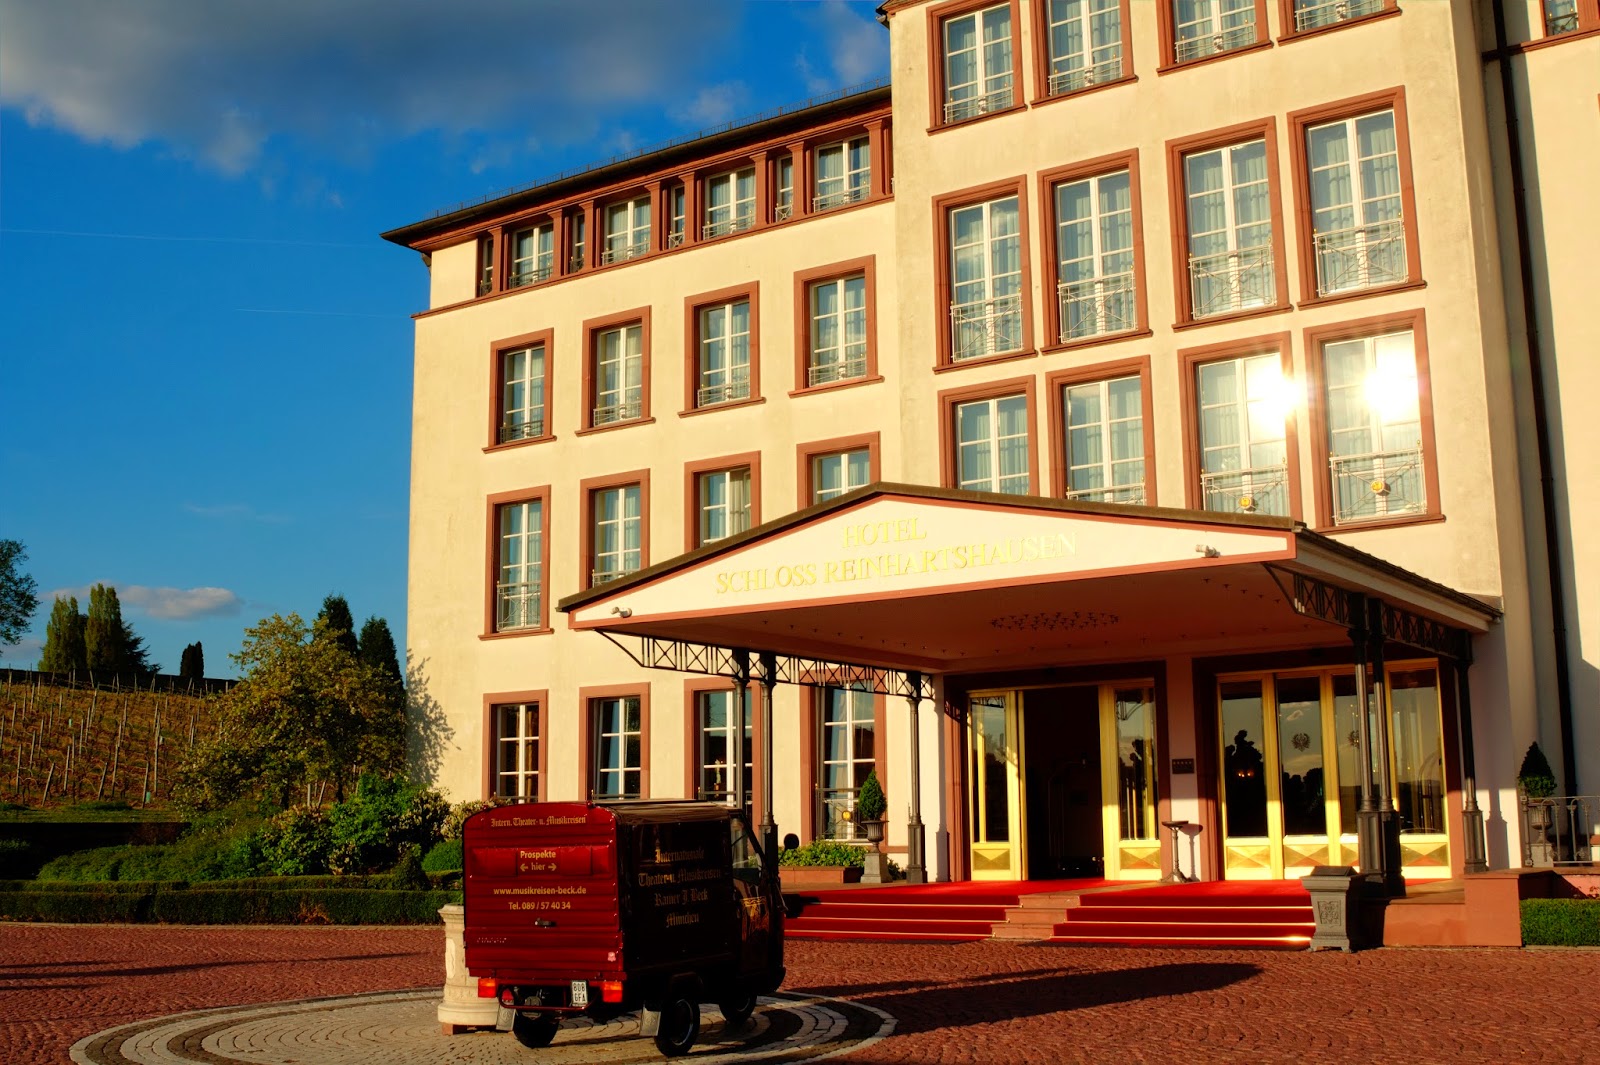 |
| HUPO-PSI 2014 Venue: Kempinsky Echerback Hotel. |
Proteomics Standard Initiative formally started in 2002 (they have more than 12 years). Since the first manuscript published by the group (Meeting Review: The HUPOProteomics Standards Initiative meeting: towards common standards for exchangingproteomics data), they addressed major challenges in this topic for the community:
“There was a remarkable consensus between delegates attending the PSI meeting to the effect that valuable data would be lost without public repositories and common interchange formats making information accessible to the scientific community… All such efforts require support from the user community and from the scientific press and funding agencies.”
The HUPO-PSI consortium has been working in in four major groups: (i) Molecular Interactions, (ii) Mass Spectrometry, (iii) Proteomics Informatics, (iv) Protein separations. From my point of view, the major results that were obtained under the PSI umbrella were:
- Definition guidelines and Control Vocabularies to report Proteomics and molecular interactions data [1][2].
- Development of PSI standard file formats (mzML, mzIdentML, mzQuantML, qcML, mzTab, PSI-MI, MITAB).
- Implementation of different resources and tools for standardization, visualization and sharing of proteomics data (PRIDE, Intact, Reactome, PRIDE Inspector, PRIDE Converter, ProteoWizard, etc)
Description of major outcomes and results
Guidelines and Control Vocabularies to report Proteomics and molecular interactions data: The minimum information about experiments [1][2] series is a collection of manuscripts and guidelines to encourage the standardised collection, integration, storage and dissemination of proteomics data, the HUPO-PSI develops guidance modules for reporting the use of techniques such as gel electrophoresis, mass spectrometry and protein interaction networks.
The MIAPE and MIMIx Guidelines are divided in various modules:
· Study design and sample.
· Experimental motivation and design; factors of interest; origin and preprocessing of biological material; numbers of replicates; relationship to other studies; miscellaneous administrative detail.
· Separations and sample handling.
· Column chromatography
· Capillary electrophoresis.
· Mass spectrometry.
· Informatics for mass spectrometry.
· Gel electrophoresis.
· Gel image informatics.
· Protein and peptide arrays.
· Statistical analysis of data
· Molecular interaction experiments.
 |
| Different paths and ideas, but only those well supported and structured are successful. |
In black are the more successful modules in terms of data standards, resources, tools and benefits provided to the proteomics community (from my point of view). These modules demonstrated the importance of having a good idea, a progressive field and a powerful community behind. The mass Spectrometry and Informatics for mass spectrometry modules have been led by PeptideAtlas and PRIDE groups amount others. These groups have relied their pipelines, data and tools in the progress of the controlled vocabularies, standards and guidelines for data publication and dissemination. The molecular interaction module has been a cornerstone of the development of the Intactdatabase (http://www.ebi.ac.uk/intact/) and PSIQUIC (https://code.google.com/p/psicquic/). Some notes from the meeting and current status of each module:
The mass spectrometry guidelines have been guided the development of standards for MS/MS representation and the final development of mzML. MzML is still under active development; advances in technologies provide new challenges, which need to be met by these standard, including the application of mzML to metabolomics, SWATH-MS and other data-independent acquisition workflows, and ion mobility MS. mzML is suitable for metabolomics with only the addition of new CV terms required to meet the current needs of this community. To tackle the issue of data compression, the use of mgzip combined with a new compression method MS-Numpress will yield mzML files that are often smaller than vendor files.
 |
| mzML all about compression using MS-Numpress and mgzip |
mzML is a mature file format because it can represent chromatography information and MS information in the same file and with the new improvements the size of the file has been decreased considerably compare with its competitors mz5, mzXML, etc. The mass spectrometry community still has some challenges for the future with the evolution of some topics such as ion-mobility and DIA (data independent acquisition). Issues remaining to be resolved by this group include deciding the means by which synthesized MS2 spectra acquired from MSE, i.e. a data-independent approach that acquires MS1 and MS2 mass spectra in an unbiased and parallel manner, and also how merged, clustered spectra should be captured in mzML.
Informatics for mass spectrometry guidelines has been involved in the development and implementation of standards to represent the process of identification, quality assessment and post-processing of mass spectrometry data. Apart of the ontologies and the important work done in standardization the main output of this group is the release of mzIdentML. mzIdentML was released in 2012 and is the successor of pepXML and protXML file formats. The mzIdentML standard for peptide/protein identification also requires some updates to meet the needs of protein grouping including statistical thresholds for protein groups, support for peptide-level statistics, support for the use of multiple search engines in mzIdentML and the first support for chemical cross-linking studies.
 |
| mzTab (Laurel) & mzIdentML(Hardy) |
Recently this group developed the mzTab, a lightweight file format for peptide/protein identification and quantitation. mzTab has been used for proteomics but also for metabolomics. As a bioinformatician and user of mzTab, I really like the general way of modelling quantitation experiments. As a developer, I like the simplistic way to represent different complex data in one format; is really simple in terms of data structure and easy to learn. Also the size of one complete experiment should be 1/20 of a mzIdentML file. Both file formats are now supported by PRIDE Inspector to check the quality of Proteomics Experiments.
Molecular interaction experiments module has been working in the development of molecular interaction resources, standards, controlled vocabularies, etc. The main work of the molecular interaction in this meeting was related with PSI-MI XML standard to enable:
· The ability to exchange “abstracted” data, i.e. knowledge built from experimental data such as protein complex composition/topology and cooperative interactions.
· The ability to add information on dynamic interactions.
· The requirement to capture the causality of molecular interactions needs further discussion with external groups to ensure we have adequate data capture and in an appropriate for- mat.
The group then discussed the development of the JAMI Java application programming interfaces. JAMI is a single Java library designed to unify both the MITAB and PSI-XML standard formats by providing a common Java framework, while hiding the complexity of both from the naive user similar to other proteomics libraries such as ms-data-core-api (https://github.com/PRIDE-Utilities/ms-data-core-api). Once the first version of the JAMI core data model has been released, subsequent tool development will be made easier as tools need not be format specific.
On the last day, a complete session was dedicated to ProteomeXchange: major results and future challenges. Some of the partners involved in ProteomeXchange gave talks about their resources and tools. The advances and future developments in resources such as PRIDE, PeptideAtlas and MassIVE were presented and discussed in details. These three resources are the main partners of the consortium at the moment. Robert Chalkley also gave a really nice introduction to MS-viewer: a web-based spectral viewer for proteomics results.
These are some of my quick notes and also some documentation from "Meeting New Challenges: The 2014 HUPO‐PSI/COSMOS Workshop." HUPO-PSI is history and I was part of it. Future challenges have emerged from discussions and new ideas. I met really nice people during the meeting, guys that made our life easy in the lab.
 |
| Some of the participants in the HUPO-PSI and ProteomeXchange meeting. |
References
[1] Taylor CF, Paton NW, Lilley KS et al. The minimum information about a proteomics experiment (MIAPE). Nat Biotechnol. 2007 Aug;25(8):887-93.
↧
Trends in Mass Spec Instruments
I'm not doing marketing for any of the mass spec producers. Here a recently statistic I got about the use of different mass spec instruments using the public data in PRIDE Archive. It can help to researcher to eveluate which are the most popular and well-stablished instruments.

↧
↧
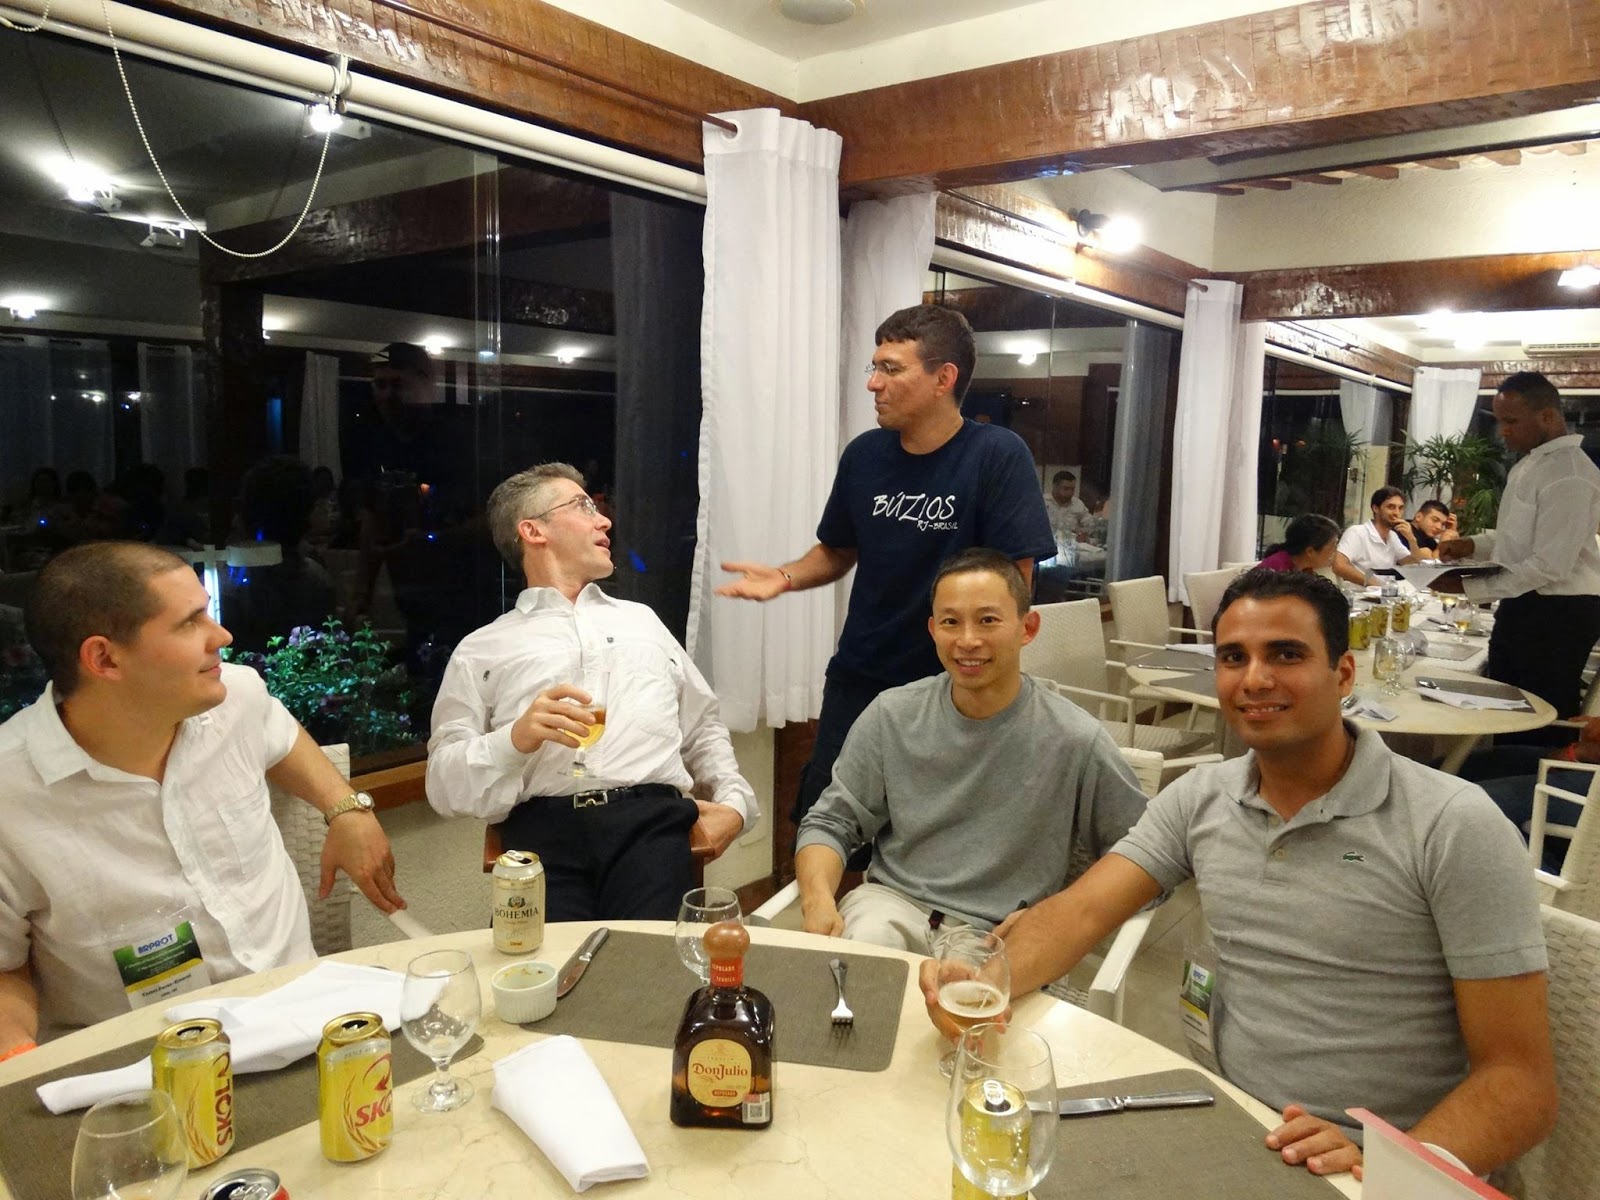
Brazil: A place for Science and Friendship
 |
| Búzios |
It's really difficult to break stereotypes, especially for developing countries, like Brazil. If you mention its name around the world they are immediately associated with: sports, music, beaches, rum and "País do Carnaval". If you ask to someone in the streets of Germany or China about personalities from Brazil, they will mention Pelé. Breaking stereotypes is a task for years or centuries but we are going in the right direction.
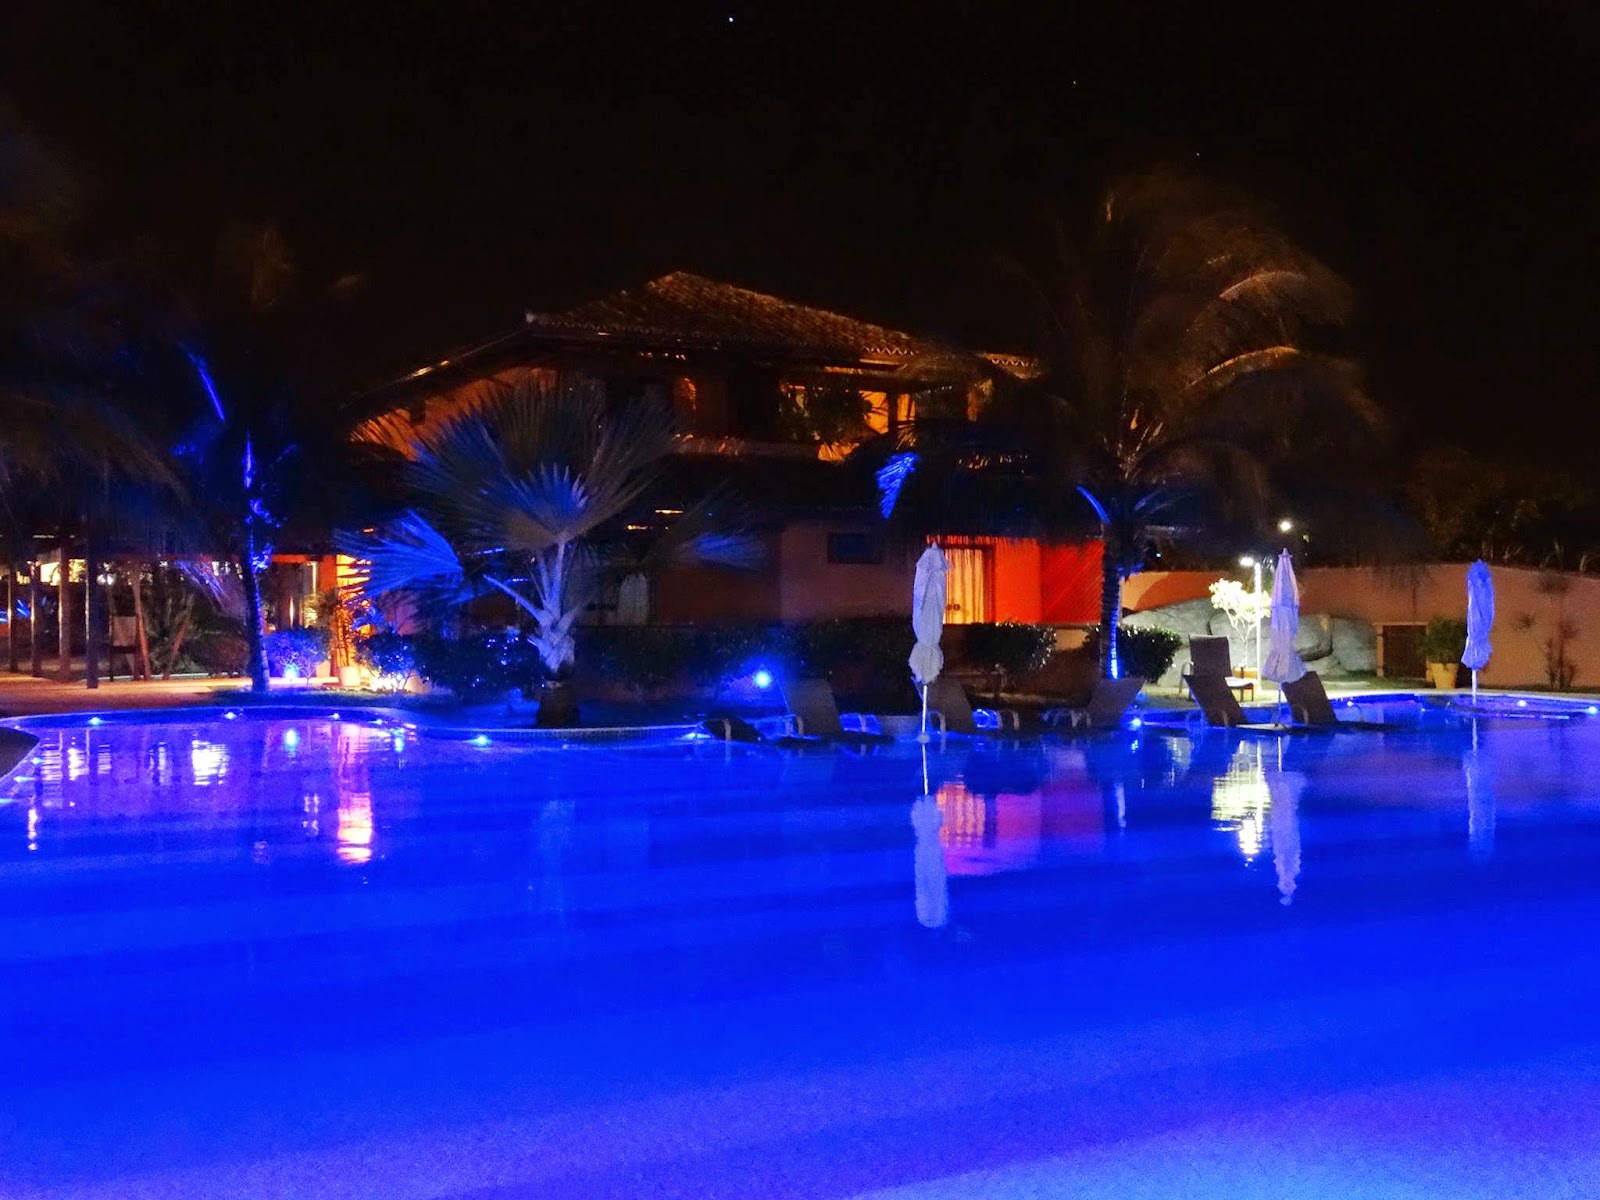 |
| Hotel Ferradura/ Ferradura Resort |
Last December I attended to the 2nd Proteomics Meeting of the Brazilian Proteomics Society jointly with the 2nd Pan American HUPO Meeting in Hotel Ferradura/ Ferradura Resort, Búzios, Rio de Janeiro State, Brazil. The venue was gorgeous, mountains close to a small bay that offers calm, clear waters and the open sea. We arrived after 2 hours by car from Rio international airport. My plans, give a talk about PRIDE and ProteomeXchange but more than that, my talk was about "if we really need to share our proteomics data".
What I learn quickly
The first steps to establish a proteomics and mass spectrometry sociaty in Brazil were given back to the 1980s by protein chemists and mass spectrometrists in parallel. The first group composed by Professors as Lauro Morhy (University of Brasilia, UnB), Gilberto B. Domont (Federal University of Rio de Janeiro, UFRJ), Lewis J. Greene (USP), Benedito de Oliveira, Sergio Marangoni and José Camillo Novello from the University of Campinas (UNICAMP), and Mario S. Palma (São Paulo State University, UNESP). The second group mainly headed by Professors Marcos N. Eberlin (UNICAMP) – current president of the International Mass Spectrometry Foundation (IMSF) – and José Manoel Riveiros (USP). In 1992, Prof. Marcelo Valle de Sousa (UnB) heard for the first time about peptide mass fingerprinting from Prof. Peter Roepstorff in a conference and soon after, they were already collaborating. This helped in the set up of the first Brazilian Proteomics Laboratory headed by Prof Sousa and Carlos A. Ricart.
This early efforts produce at the end of the 1990s, a generation of proteomic scientists such as Marcus B. Smolka, Fabio Gozzo, Vitor M. Faça, Daniel Martins de Souza, Paulo Costa Carvalho, Ana Gisele da Costa Neves Ferreira, proteomic pipelines in different parts of the country. In 2000, Prof. Gilberto B. Domont (UFRJ) proposed the creation of the Rio de Janeiro Proteomics Network together with Drs. Jonas Perales, Ana Gisele CN Ferreira and Richard H Valente (Fiocruz Foundation) and Professors Russolina Zingalli and Paulo Bisch (UFRJ), establishing a powerful center for proteomics investigation in Brazil. In 2003, Prof. Domont inaugurated at the Annual Meeting of the Brazilian Society for Biochemistry and Molecular Biology (SBBq) a “Proteomics Symposium” which has become an annual tradition of the Conference and has moved and aroused interest of many students and scientists towards proteomics.
A place for good and ditributed science
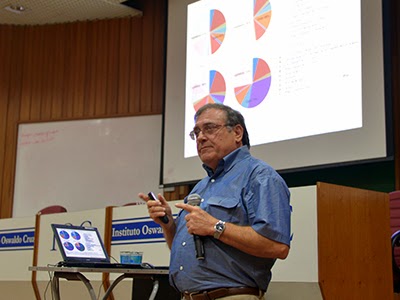 |
| Gabriel Padron |
For me it was impresive how well-distributed is proteomics in Brazil. Usually in developing countries science is done in a central place or the most important cities, no more than two big labs. For example, this is the case for Cuba, were proteomics has been developed only in Padron's Lab for more than 20 years. However, as far as I see in Brazil, all the labs have their own goals, strategies and research field without big overlaping. Four of the young groups that are doing really great things:
Fabio Gozzo's Lab: The main focus of the research group is structural proteomics using mass spectrometry (MS), with a focus on chemical cross-linking methods.
 |
| Daniel's Lab |
Daniel's Lab: The Neuroproteomics Lab aims to unravel the molecular mechanisms and biomarkers candidates associated to psychiatric disorders using proteomic tools.
Paulo's Group: This groups is the leadering bioinformatics group in Brazil. They develop a set of user-friendly tools around the PatternLab platform for computaional proteomics. These tools are widelly used in Brazil and by other groups around the world.
Gilberto's Group: In the last 10 years this group have been working in cancer research, plant proteomics and in the last two years it is working on C-HPP project in human chromosome 15. Some former graduate students mentored by Gilberto at the Laboratory of Toxinology, Fiocruz Foundation in Rio de Janeiro: Jonas Perales (post-doc with Cassian Bon, Institute Pasteur, France) and Ana GCN Ferreira and Richard H Valente, post-docs at PRG, Odense, Denmark with Peter Roepstorff and Thomas Morgensen, respectively.
 |
| Gilberto's Lab |
A place for friendship..
 |
| Gilberto Domont |
But, all of this history is also about friendship and about people like Gilberto Domont "The proteomics Pelé". As he said in his 80's party: (...) "science is about honesty, the true and friendship". Gilberto has the merit of having built a network of friends and colleagues around the same topic "proteomics" and "mass spectrometry".
The installment of a proteomic network in Rio de Janeiro state was proposed to FAPERJ in October, 2000, by Gilberto. Five groups earned the grant to develop four projects: Vibrio cholera, dengue, snake venoms and proteome of Gluconacetobacter diazotrophicus, a nitrogen fixing bacteria. Later on, in 2006, two laboratories resigned and the network incorporated three others from UFRJ, National Cancer Institute and the University of the State of Rio de Janeiro. In order to join Rio de Janeiro Proteomics Network, the traditional Protein Chemistry Laboratory of the Institute of Chemistry headed by GB Domont created its Proteomics Unit. The Protein Chemistry Lab is a pioneer center in protein sequence in Brazil irradiating classical protein chemistry and proteomics to the country.
 |
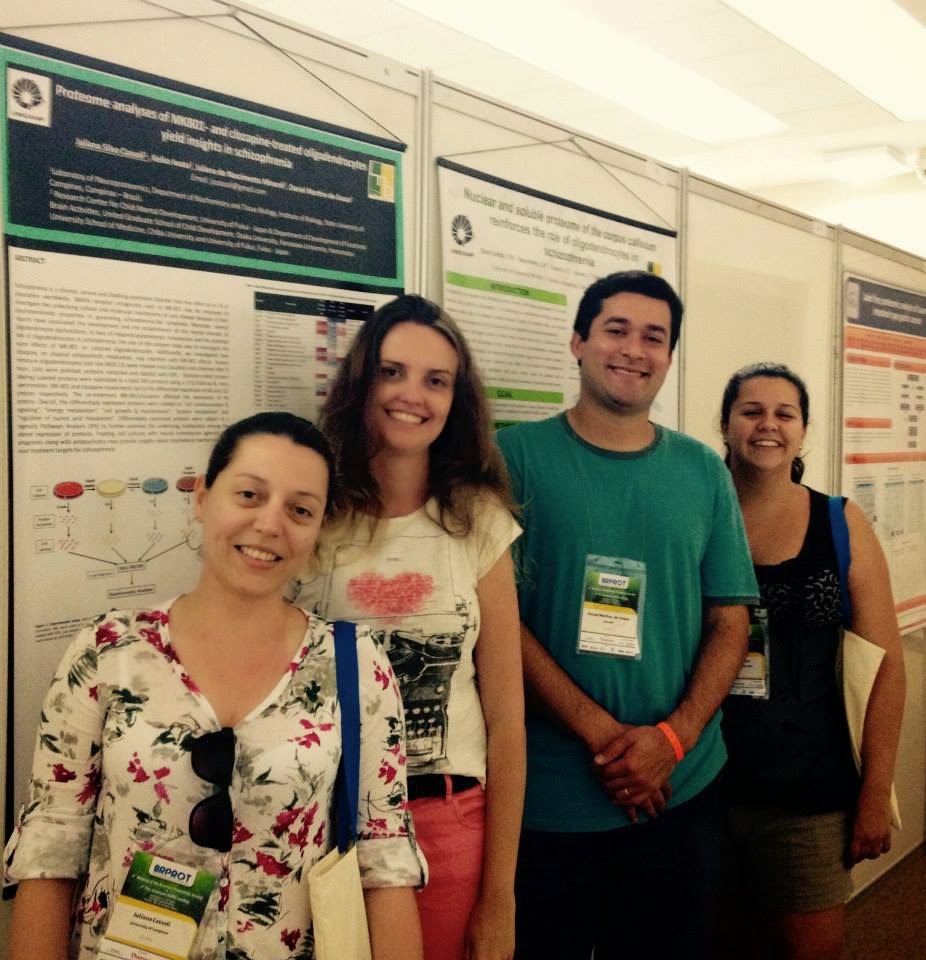
| The Computational proteomics Team: "always discussing" |
Sensing the growth of proteomics in Brazil, the Unit conducted the foundation of the Brazilian Society on Proteomics, which held its first meeting in December 2012. It has over 200 members and it organized the 2nd Proteomics Meeting jointly with 2nd PanAm HUPO in December, 2014. GB Domont is a member of the Editorial Board of the Journal of Proteomics and Associate Editor of the Journal of Proteome Research as well as a member of HUPO Council. The Unit is part of the International Consortium to study chromosome 15 inside the Chromosome-centric Human Proteome Project/Biology Diseases.
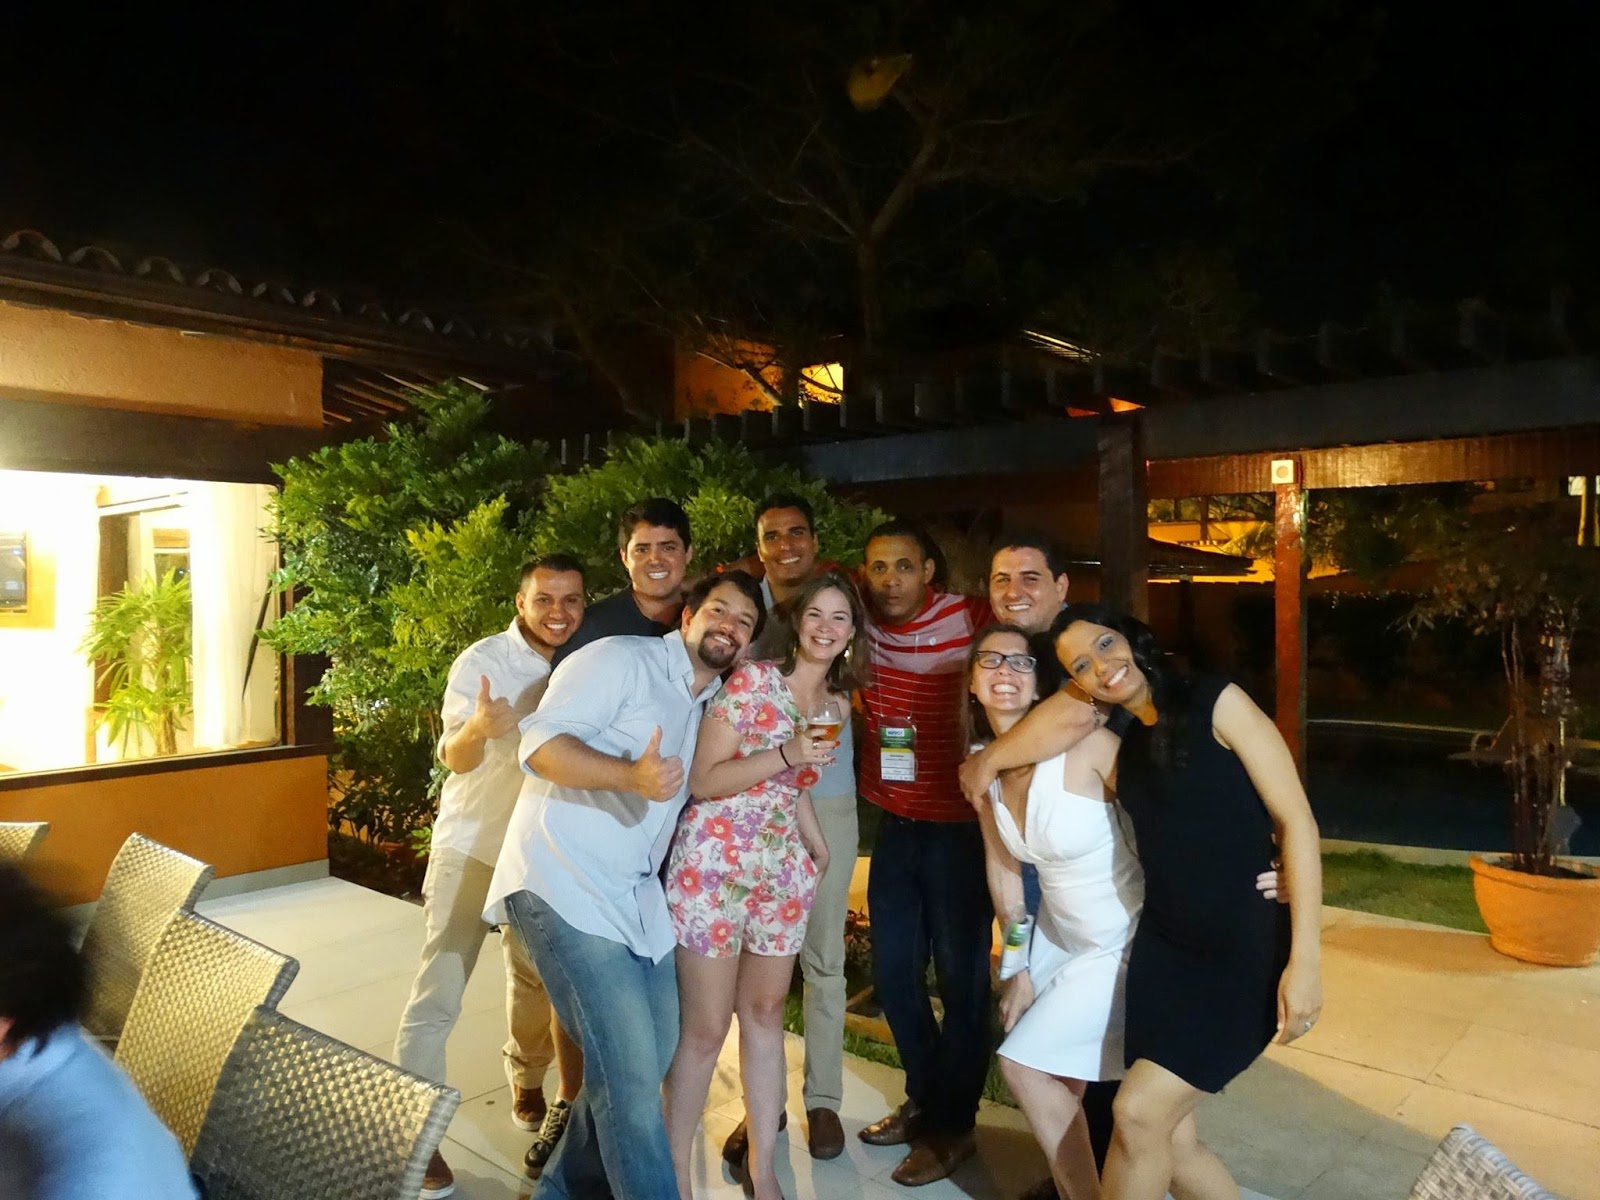
Brazil is for sure not only a place for futbool and Samba. It is also a great place for sharing ideas about science, software development, research and PROTEOMICS. I saw in the Poster session more than 10 posters already published in MCP, Journal of Proteome Research or Journal of Proteomics. I saw undergraduated students with more than two publications. I saw intense discussions between laughters and friendly atmosphere.
My biggest lesson was that science is about friendship, collaboration and humility!!!!!
Special issues with Brazil Proteomics Results:
- Editorial: Genomics and proteomics behind drug design. Perez-Riverol Y, Carvalho PC. Curr Top Med Chem. 2014;14(3):343.
↧
It's impossible to conduct research without software, say 7 out of 10 UK researchers
 By Simon Hettrick, Deputy Director. Originally posted in SSI
No one knows how much software is used in research. Look around any lab and you’ll see software – both standard and bespoke – being used by all disciplines and seniorities of researchers. Software is clearly fundamental to research, but we can’t prove this without evidence. And this lack of evidence is the reason why we ran a survey of researchers at 15 Russell Group universities to find out about their software use and background.
Headline figures
- 92% of academics use research software
- 69% say that their research would not be practical without it
- 56% develop their own software (worryingly, 21% of those have no training in software development
- 70% of male researchers develop their own software, and only 30% of female researchers do so
Data
The data collected from the survey is available for download and is licensed under a Creative Commons by Attribution licence (attribution to The University of Edinburgh on behalf of the Software Sustainability Institute).Software is far more important to research than anyone knows
If we do not know how much we rely on software, we cannot ensure that researchers have the tools and skills they need to stay at the forefront of research. We collected evidence – for the first time at this scale - of research software use, development, and training. In addition, we collected demographic data so that we can investigate questions like “Are men more likely to develop software than women?” (the answer, as it turns out, is yes - but women are equally likely as men to use research software).The team
Thanks to Mario Antonioletti, Neil Chue Hong, Steve Crouch, Devasena Inupakutika, and Tim Parkinson for their help constructing the survey, developing the underlying code and analysing the results. Thanks also to our Fellows for being guinea pigs during the drafting of the survey.The scale of the survey
The survey results described here are based on the responses of 417 researchers selected at random from 15 Russell Group universities. We gained good representation from across the disciplines, seniorities and genders. This is a statistically significant number of responses that can be used to represent, at the very least, the views of people in research-intensive universities in the UK.Limitations
The main problem of running a blind survey is that it needs to be short to maximise responses. This means we’ve had the opportunity to uncover facts about software use, but we haven’t had the space to investigate causes. We will be running follow up research to do so.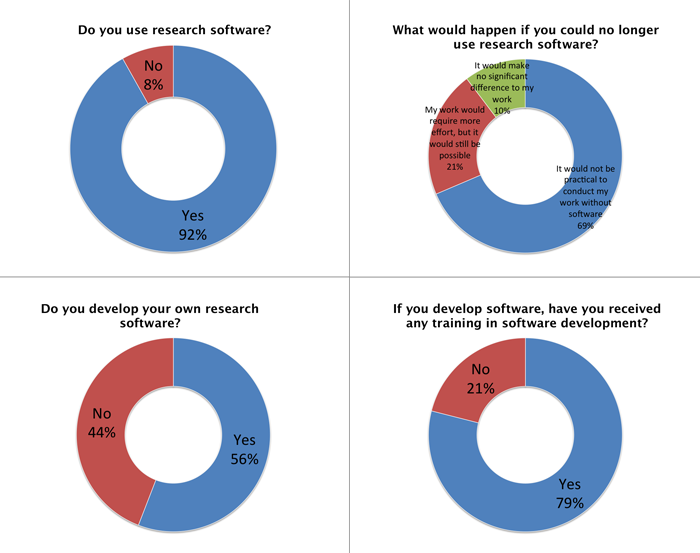
How many researchers use software?
It’s not overstating the case to say that software is vital to research. If we were to magically remove software from research, 7 out of 10 researchers would be out of a job.92% of respondents said they used research software. More importantly, 70% of respondents said that “It would not be practical to conduct my work without software”.
Variation in use with seniority of respondent
The use of research software varies little with seniority.It’s difficult to measure seniority, so we simply asked how many years the respondents had worked in research. There isn’t a great deal of variation: the percentage of use varies by 12% with those having worked in research for 6-10 years reporting the most use (98%) and those having worked for more than 20 years in research reporting the lowest use (86%).
The first two categories – those have worked less than a year, and those that have worked for 1-5 years – report 91-92% use. Use peaks in the next ten years and then drops in the 15-20 year and more than 20 year groups.
There are different ways to explain this variation. Unfortunately, they cannot be confirmed by our data. It seems likely that low- and mid-seniority researchers are the workhorses of research and do the most generation of results – and hence are most likely to use software. Once a researcher gets more senior, there is the tendency to perform more management duties which makes them less likely to use research software.
What software are people using?
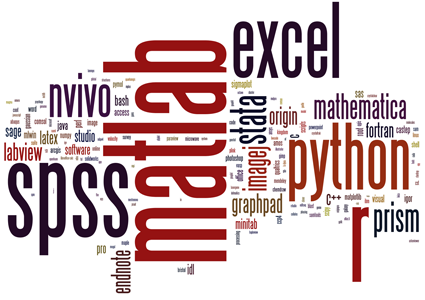
A lot of different software is being used: we recorded 566 different packages - some of them have only one user within our surveyed community, some with many. The most popular packages are Matlab (20% of respondents use it), R (16%), SPSS (15%), then Excel (12%). To show the use diagrammatically, we created the Wordle shown at the top of the page.A lot of researchers are developing their own software – even though they lack training
It’s not just proprietary software, many researchers are developing their own code: 56% of them. This is great news, because the real power of software lies in developing it to allow you to do more in less time and make new research possible.Many people in the research community are developing their own software, is the development in safe hands?
55% of respondents have received some training in software development (15% self taught and 40% had received some form of taught course). Worryingly, 21% of respondents who develop their own software had no training in software development. That’s one in five researchers developing software blind.
Software that is developed without adequate training is unlikely to be reliable. Researchers are, by their very nature, intelligent people who learn new skills quickly, but there are many subtle pitfalls in developing good code (that is, code that won’t later lead to paper retractions). And that’s only the case for reliability! We want defensible results, which requires a whole swathe of skills related to producing reproducible code, and we want to protect the research investment, which requires yet more skills for writing reusable software.
Changes across disciplines
The primary funder is a useful way to split respondents into different disciplines. Around half of our respondents were primarily funded by the EPSRC, university central funds and “other” (which drew together a wide range of funders from private funds to overseas research funders). The other half of respondents were split fairly evenly over the remaining research councils, EU funding and the big trusts and charities.The use of research software is fairly even across all respondents regardless of their primary funder: something in the region of 87-100% is typical. The notable exception was respondents primarily funded by the AHRC, of whom only 60% use research software.
The gaps begin to appear when we look at respondents who develop their own software. Respondents can be split into three groupings. Leading the way are STFC-, NERC- and EPSRC-funded researchers with 93%, 90% and 79% of them, respectively, developing their own software. The next grouping occurs around the 50% mark – a group that contains respondents funded by most of the other funders. The third group is made up of respondents funded by the National Institute for Health Research (31%), industry (17%) and the AHRC (10%).
Unsurprisingly perhaps, the percentage of researchers who have received some form of software development training tracks the percentage of who develop software. There is a variation between these categories of around +/- 10%
Software development costs are not being included in bids
Many researchers believe that including costs for developing software in a proposal will weaken it. We’ve had steer from the Research Councils that this is not the case - something we’re trying to persuade the research community to believe. But we may have our work cut out.When we asked the people who are responsible for writing proposals whether they had included costs for software development, 22% said that they had, 57% said they had not, and 20% said that they had noteven though they knew software development would make up part of the bid! (Note that rounding errors make these figures sum to 99%.)
Differences in software use with respect to gender
Women made up 36% of respondents to the survey, men made up 62% and the remainder went to “other”, “prefer not to say” or no response (the gender question was not mandatory).There is no difference in the percentage of women and men who use research software: 92% each. This is heartening news!
Differences in software development with respect to gender
Although there is no difference in the use of research software, there is a huge difference when it comes to developing software: 70% of men develop their own research software, whereas only 30% of women do.This preponderance of men in development is reflected, as one would expect, in training. Only 39% of women had received software development training of some form, relative to 63% of men who have received training.
What can you tell from a researcher’s operating system of choice?
There is a difference, albeit not a great one, when it comes to simply using research software: 88% of Windows users are also users of research software, as compared to 93% for OS X and a remarkable 98% for Linux.When it comes to developing research software, the differences become apparent. Only 41% of Windows users develop research software, which again is slightly behind OS X at 53%. Linux users are in a field of their own: 90% of them develop their own research software.
There’s potentially an important lesson in here for the software development community. If you want to people to use your software, you really better make sure that it runs on Mac and Windows as well as your native Linux.
How did we collect the data?
We needed results that would represent the research community, so we ran a survey that contacted 1,000 randomly selected researchers at each of 15 Russell Group universities. From the 15,000 invitations to complete the survey, we received 417 responses – a rate of 3% which is fairly normal for a blind survey.We asked people specifically about “research software” which we defined as:
“Software that is used to generate, process or analyse results that you intend to appear in a publication (either in a journal, conference paper, monograph, book or thesis). Research software can be anything from a few lines of code written by yourself, to a professionally developed software package. Software that does not generate, process or analyse results - such as word processing software, or the use of a web search - does not count as ‘research software’ for the purposes of this survey.”We used Google Forms to collect responses. The results were transferred to Excel for analysis and then uploaded to Google Drive for distribution.
Posted by s.hettrick on Thursday 4 December 2014.
↧
Bioinformatics for Proteomics Course, Bergen, April 21-24th 2015
The course will include lectures and practicals on open access software for the analysis of mass spectrometry generated proteomics data. Among the tools covering both protein identification and quantification are: SearchGUI, PeptideShaker, MaxQuant, Perseus and Skyline.
Topics Covered:
Why is the experimental design important? What is a protein database? How to convert raw mass spectrometry data to the required formats? What is a proteomics search engine and how do they work? What is protein inference and why is it important? How to interpret and validate proteomics results? What is functional analysis of proteomics data? How to share and reprocess proteomics data? How to quantify proteins?
Special Guest Lecture:
"Introduction to mass spectrometry based proteomics" by Prof. Dr. Lennart Martens from Ghent University and VIB, Ghent, Belgium.
For more details and registration please see the course details.
↧
Quick Guide to the New Uniprot Web

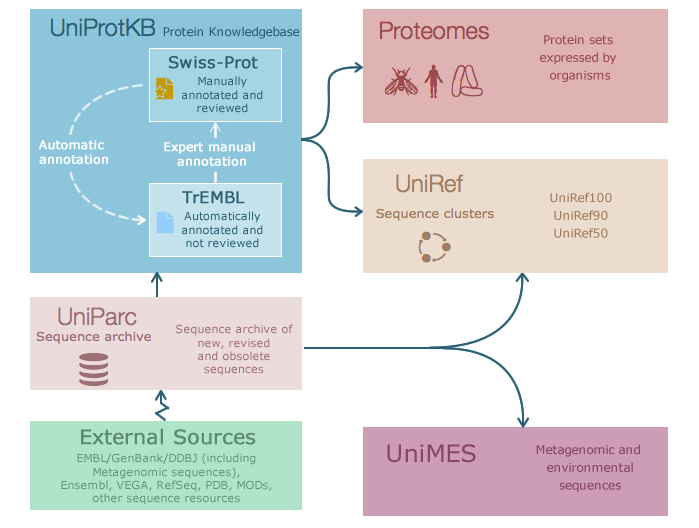
Probably Uniprot is one of the most used and well-established services in bioinformatics worldwide. With more than 12 years, is one of the major resources of biological information and the reference catalog of protein sequence in the World. The aim of Uniprot is provide the scientific community with a single, centralized, authoritative resource for protein sequences and functional information. It started in 2002 when the Swiss‐Prot, TrEMBL and PIR protein database activities have united to form the Universal Protein Knowledgebase (UniProt) consortium.
Nowadays, the UniProt databases are the UniProt Knowledgebase (UniProtKB), the UniProt Reference Clusters (UniRef), and the UniProt Archive (UniParc). The UniProt Metagenomic and Environmental Sequences (UniMES) database is a repository specifically developed for metagenomic and environmental data.
UniProt is a collaboration between the European Bioinformatics Institute (EMBL-EBI), the SIB Swiss Institute of Bioinformatics and the Protein Information Resource (PIR).
EMBL-EBI and SIB together used to produce Swiss-Prot and TrEMBL, while PIR produced the Protein Sequence Database (PIR-PSD). TrEMBL (Translated EMBL Nucleotide Sequence Data Library) was originally created because sequence data was being generated at a pace that exceeded Swiss-Prot's ability to keep up. Meanwhile, PIR maintained the PIR-PSD and related databases, including iProClass, a database of protein sequences and curated families.
Proteomes Sets?
A proteome consists of the set of proteins thought to be expressed by an organism whose genome has been completely sequenced.
Reference proteome sets?
Some proteomes have been (manually and algorithmically) selected as reference proteomes. They cover well-studied model organisms and other organisms of interest for biomedical research and phylogeny.
What are the differences between Swiss-Prot and TrEMBL?
UniProtKB/TrEMBL (unreviewed) contains protein sequences associated with computationally generated annotation and large-scale functional characterization. UniProtKB/Swiss-Prot (reviewed) is a high quality manually annotated and non-redundant protein sequence database, which brings together experimental results, computed features and scientific conclusions.
The new Web!!!
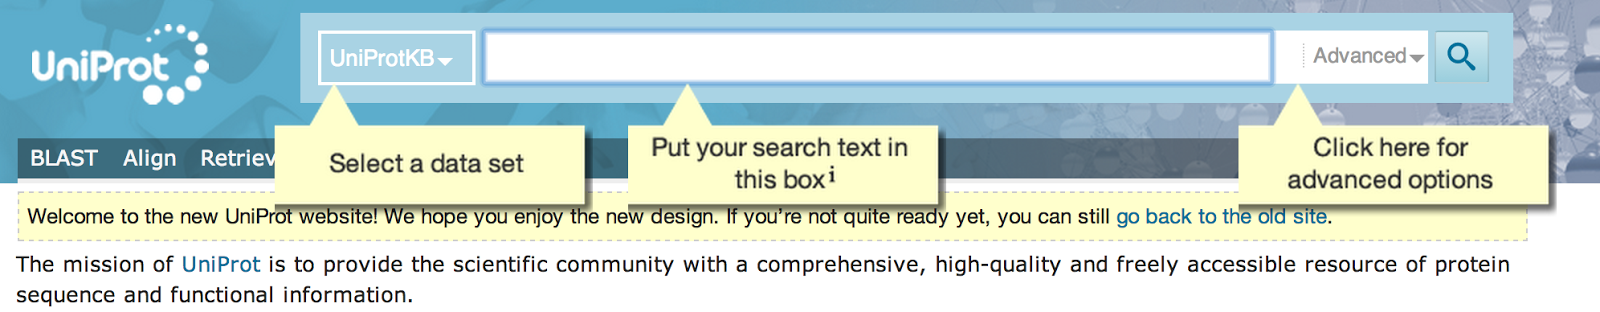

The six main datasets are UniProtKB, UniRef, UniParc, Proteomes, Supporting data, and Help pages.
How to retrieve ID and mapping your ID Lists?
Enter or upload a list of identifiers to do one of the following:
Retrieve the corresponding UniProt entries to download them or work with them on this website. Convert identifiers which are of a different type to UniProt identifiers or vice versa and download the identifier lists.
Protein Lists
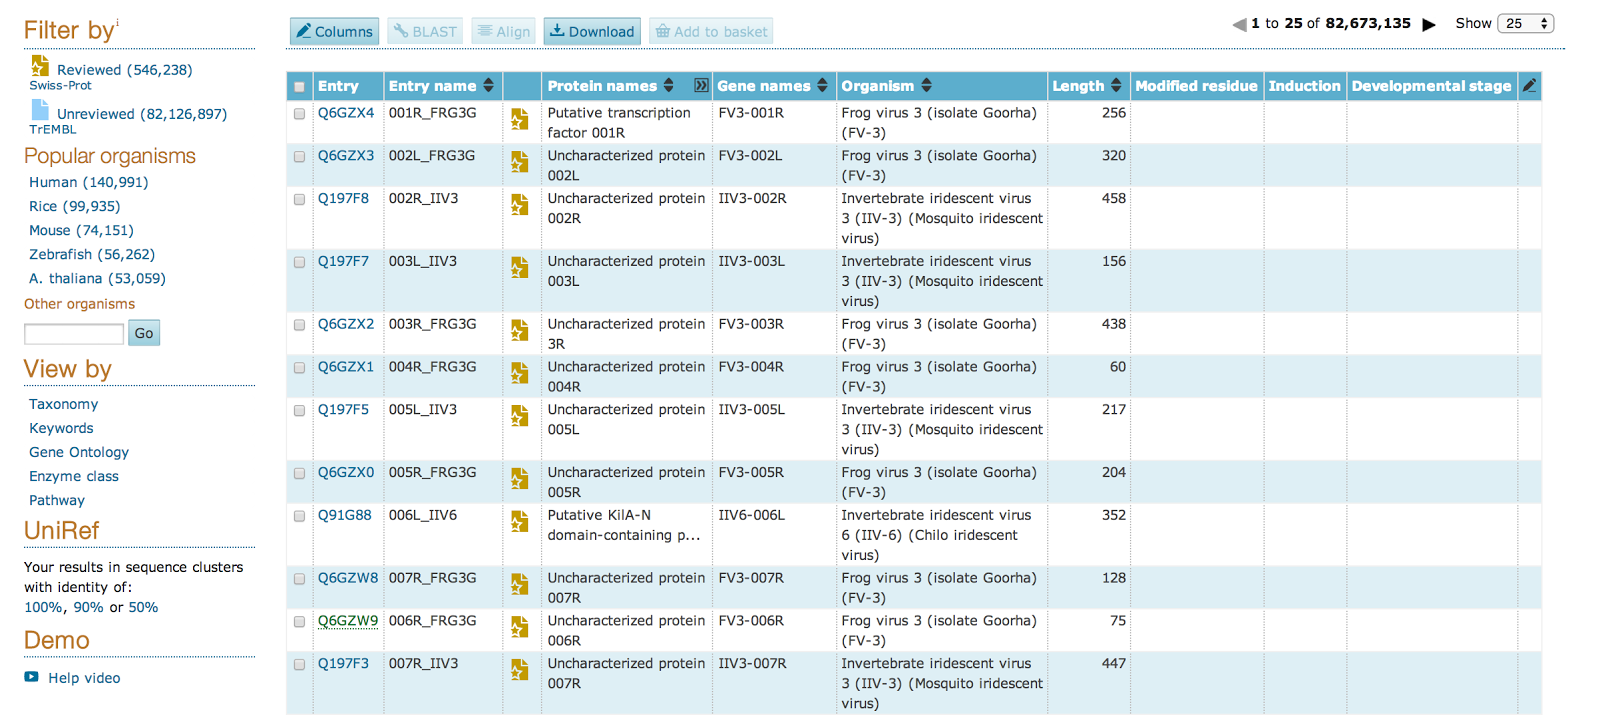
The Uniprot browser allows the user to browse in Uniprot resources. In addition to capturing the core data mandatory for each UniProtKB entry (mainly, the amino acid sequence, protein name or description, taxonomic data and citation information), as much annotation information as possible is added.
A search result page is subdivided into a filter panel on the left, and the actual result table on the right, occupying the majority of the screen space. The filter panel provides different filters to the final list of proteins such as taxonomy, organism or if the proteins is reviewed or unreviewed.
The Uniprot Entry View
Major features:
* More clear, fast and simple web design.
* More documentation including videos, tutorials and course materials.
* More resources: Proteomes, Supporting Information
* Better integration between resources.
* Better usability in terms: more intuitive, well-structured and best navigation.
Well done Uniprot Team!!
↧
↧
GPMDB identifications by Original source

Source:
@GPMDB BTW do you have an idea how many datasets in GPMDB comes from MassIVE, PRIDE, Tranche and how many were deposited direct in GPMDB.
— Yasset Perez-Riverol (@ypriverol) March 8, 2015@ypriverol in %proteinids: tranche 14,pride 2,px 37,cptac 19,pep-atlas 8, peptidome 1,massive 3,chorus 3,proteomicsdb 1,other 12
— Ron Beavis (@GPMDB) March 8, 2015
↧
Quick Guide to the New Uniprot Web
Probably Uniprot is one of the most used and well-established services in bioinformatics worldwide. With more than 12 years, is one of the major resources of biological information and the reference catalog of protein sequence in the World. The aim of Uniprot is provide the scientific community with a single, centralized, authoritative resource for protein sequences and functional information. It started in 2002 when the Swiss‐Prot, TrEMBL and PIR protein database activities have united to form the Universal Protein Knowledgebase (UniProt) consortium.
Nowadays, the UniProt databases are the UniProt Knowledgebase (UniProtKB), the UniProt Reference Clusters (UniRef), and the UniProt Archive (UniParc). The UniProt Metagenomic and Environmental Sequences (UniMES) database is a repository specifically developed for metagenomic and environmental data.
UniProt is a collaboration between the European Bioinformatics Institute (EMBL-EBI), the SIB Swiss Institute of Bioinformatics and the Protein Information Resource (PIR).
EMBL-EBI and SIB together used to produce Swiss-Prot and TrEMBL, while PIR produced the Protein Sequence Database (PIR-PSD). TrEMBL (Translated EMBL Nucleotide Sequence Data Library) was originally created because sequence data was being generated at a pace that exceeded Swiss-Prot's ability to keep up. Meanwhile, PIR maintained the PIR-PSD and related databases, including iProClass, a database of protein sequences and curated families.
Proteomes Sets?
A proteome consists of the set of proteins thought to be expressed by an organism whose genome has been completely sequenced.
Reference proteome sets?
Some proteomes have been (manually and algorithmically) selected as reference proteomes. They cover well-studied model organisms and other organisms of interest for biomedical research and phylogeny.
Proteomes Sets?
A proteome consists of the set of proteins thought to be expressed by an organism whose genome has been completely sequenced.
Reference proteome sets?
Some proteomes have been (manually and algorithmically) selected as reference proteomes. They cover well-studied model organisms and other organisms of interest for biomedical research and phylogeny.
What are the differences between Swiss-Prot and TrEMBL?
UniProtKB/TrEMBL (unreviewed) contains protein sequences associated with computationally generated annotation and large-scale functional characterization. UniProtKB/Swiss-Prot (reviewed) is a high quality manually annotated and non-redundant protein sequence database, which brings together experimental results, computed features and scientific conclusions.
The new Web!!!
The six main datasets are UniProtKB, UniRef, UniParc, Proteomes, Supporting data, and Help pages.
How to retrieve ID and mapping your ID Lists?
Enter or upload a list of identifiers to do one of the following:
Retrieve the corresponding UniProt entries to download them or work with them on this website. Convert identifiers which are of a different type to UniProt identifiers or vice versa and download the identifier lists.
Protein Lists
The Uniprot browser allows the user to browse in Uniprot resources. In addition to capturing the core data mandatory for each UniProtKB entry (mainly, the amino acid sequence, protein name or description, taxonomic data and citation information), as much annotation information as possible is added.
A search result page is subdivided into a filter panel on the left, and the actual result table on the right, occupying the majority of the screen space. The filter panel provides different filters to the final list of proteins such as taxonomy, organism or if the proteins is reviewed or unreviewed.
The Uniprot Entry View
Major features:
* More clear, fast and simple web design.
* More documentation including videos, tutorials and course materials.
* More resources: Proteomes, Supporting Information
* Better integration between resources.
* Better usability in terms: more intuitive, well-structured and best navigation.
Well done Uniprot Team!!
↧
A Trans-Proteomic Pipeline (TPP) Docker container
By +Felipe Leprevost & +Yasset Perez-Riverol
In my initial post in this blog, I will teach you how to use a Docker container with the Trans-Proteomic Pipeline software installation.
Docker is a great new technology that allows us to create GNU/Linux containers with specific software inside. All kinds of software can be "containerized", including ones that rely on graphical user interfaces.
The whole idea of using a Docker container is built on having a software that is isolated from the host OS and can interact with the outside world. GNU/Linux containers, like Docker, are very useful even in the scientific world where bioinformatics applications are used every day.
Using Docker with bioinformatics software helps to solve some issues we face, like reproducibility, for example. We wrote about this last year [1] . You can also check for more containers with bioinformatics applications in the BioDocker webpage.
Here I am going to describe to you how to install and use one of the most powerful software for proteomics data analysis, the Trans-Proteomics Pipeline (TPP).
With a Docker TPP container you can just download it and use it on the command line, the container it self behaves like an executable, so image the possibilities.
Lets begin preparing your environment for Docker. The first thing you have to do is to install some libraries that are essential for the Docker daemon to run properly. If you are running an Ubuntu OS, you can skip this step. If you are on a different OS, like Linux Mint for example you need to follow these steps.
sudo apt-get install cgroup-lite
sudo apt-get install lxc
Now we can download and install the latest Docker version:
wget -qO- https://get.docker.com/ | sh
sudo reboot
Apparently the docker version available in the official repositories is not the latest one and you are going to find some errors while using it, so just follow the steps above and you will be fine.
Docker works by building containers of images. There is a large repository for images on the Docker website called Docker Hub. We are going to download the TPP image from it. Run the following command:
docker pull hexabio/tpp-4.8.0
Hexabio is the name of the repository and tpp-4.8.0 is the name of the image. You will see some progress bars indicating the status of your download. After that you can run the following command to see if you got the image:
docker images
You are going to see something like this:
hexabio/tpp-4.8.0 latest 1830f991f551 43 minutes ago 637.4 MB
This indicates everything went well.
To see if everything is OK we will just call the tandem executable with the following command:
docker run hexabio/tpp-4.8.0 tandem
NOTE: Docker daemon needs to be used by a sudoer user, so consider that every example bellow must be executed with the 'sudo' command. I'm omitting the sudo just to let the text cleaner.
The run parameter is to tell the docker daemon that you are going to execute something using an image, that way the container is automatically assembled and executed.
next comes the hexabio/tpp-4.8.0; that's the name of the image. The last part is the command that you want to execute. In our case it is the tandem software.
You should get the standard output from tandem complaining that there is no input XML file.
My goal here is not to teach how to use TPP, so I will presume that you know what you are doing.
TPP needs some input files in order to run the analysis properly, so go to a separate directory in your machine and create a new directory called tpp_root. Inside tpp_root you will place all the necessary files to run the Tandem software. In my directory I have the following files (notice that we are going to run the next set of commands from outside the tpp_root directory):
default_input.xml
input.xml
sample.mzML
database_td.fa
taxonomy.xml
So, being an isolated environment, my TPP container cannot see my desktop directories. What we are going to do now is to tell the container to map the tpp_root/ directory inside it self in a directory called /data/ (yes, you should use the trailing slash), in the end it will behave very similar to a shared folder, the container can read those files and can also write inside the directory:
docker run -v tpp_root/:/data/ hexabio/tpp-4.8.0 tandem /data/input.xml
The -v is the volume parameter, that's how tandem will find those files. It is saying that the tpp_root, from my OS must be mapped inside the container into /data/, The /data/ directory will be automatically created once you execute the command. The last part of the command says that I want to execute tandem and that the input.xml file is located in the /data/ directory.
It is imperative that you include into your xml files the /data/ path, do not use the tpp_root/ path, otherwise the TPP software will not find any of your files.
If everything goes well you should see the initial output from the analysis on your screen. Now you can continue the pipeline following the same basic ideas I showed.
If you got interested in how Docker works and want to use other bioinformatics applications I suggest you to take a look on the BioDocker website. I'm continually containerizing new bioinformatics software and you are welcome to join in and help. If you need some software inside a container and don't know how to do it, I'm also glad to help, just send an e-mail.
[1] Leprevost Fda V, Barbosa VC, Francisco EL, Perez-Riverol Y and Carvalho PC. On best practices in the development of bioinformatics software. Front Genet. 2014 Jul 2;5:199. doi: 10.3389/fgene.2014.00199. eCollection 2014.
In my initial post in this blog, I will teach you how to use a Docker container with the Trans-Proteomic Pipeline software installation.
Docker is a great new technology that allows us to create GNU/Linux containers with specific software inside. All kinds of software can be "containerized", including ones that rely on graphical user interfaces.
The whole idea of using a Docker container is built on having a software that is isolated from the host OS and can interact with the outside world. GNU/Linux containers, like Docker, are very useful even in the scientific world where bioinformatics applications are used every day.
Using Docker with bioinformatics software helps to solve some issues we face, like reproducibility, for example. We wrote about this last year [1] . You can also check for more containers with bioinformatics applications in the BioDocker webpage.
Here I am going to describe to you how to install and use one of the most powerful software for proteomics data analysis, the Trans-Proteomics Pipeline (TPP).
Unfortunately, if you are a GNU/Linux user (like me) and your job involve MS/MS data analysis (also, like me), you will probably have some harsh time trying to install TPP. Almost all the tutorials available on the Web focus on the Windows users, so novice bioinformaticians or those that are not too versatile with GNU/Linux can have some hard times.
With a Docker TPP container you can just download it and use it on the command line, the container it self behaves like an executable, so image the possibilities.
Lets begin preparing your environment for Docker. The first thing you have to do is to install some libraries that are essential for the Docker daemon to run properly. If you are running an Ubuntu OS, you can skip this step. If you are on a different OS, like Linux Mint for example you need to follow these steps.
Preparing your system
sudo apt-get install cgroup-lite
sudo apt-get install lxc
Now we can download and install the latest Docker version:
Installing Docker
If you are running a Debian based system you can run the following command, otherwise I advise you to check the installation guide on Docker website.wget -qO- https://get.docker.com/ | sh
sudo reboot
Apparently the docker version available in the official repositories is not the latest one and you are going to find some errors while using it, so just follow the steps above and you will be fine.
Downloading the Image
docker pull hexabio/tpp-4.8.0
Hexabio is the name of the repository and tpp-4.8.0 is the name of the image. You will see some progress bars indicating the status of your download. After that you can run the following command to see if you got the image:
docker images
You are going to see something like this:
hexabio/tpp-4.8.0 latest 1830f991f551 43 minutes ago 637.4 MB
This indicates everything went well.
Testing the Container
To see if everything is OK we will just call the tandem executable with the following command:
docker run hexabio/tpp-4.8.0 tandem
NOTE: Docker daemon needs to be used by a sudoer user, so consider that every example bellow must be executed with the 'sudo' command. I'm omitting the sudo just to let the text cleaner.
The run parameter is to tell the docker daemon that you are going to execute something using an image, that way the container is automatically assembled and executed.
next comes the hexabio/tpp-4.8.0; that's the name of the image. The last part is the command that you want to execute. In our case it is the tandem software.
You should get the standard output from tandem complaining that there is no input XML file.
Running TPP
My goal here is not to teach how to use TPP, so I will presume that you know what you are doing.
TPP needs some input files in order to run the analysis properly, so go to a separate directory in your machine and create a new directory called tpp_root. Inside tpp_root you will place all the necessary files to run the Tandem software. In my directory I have the following files (notice that we are going to run the next set of commands from outside the tpp_root directory):
default_input.xml
input.xml
sample.mzML
database_td.fa
taxonomy.xml
So, being an isolated environment, my TPP container cannot see my desktop directories. What we are going to do now is to tell the container to map the tpp_root/ directory inside it self in a directory called /data/ (yes, you should use the trailing slash), in the end it will behave very similar to a shared folder, the container can read those files and can also write inside the directory:
docker run -v tpp_root/:/data/ hexabio/tpp-4.8.0 tandem /data/input.xml
The -v is the volume parameter, that's how tandem will find those files. It is saying that the tpp_root, from my OS must be mapped inside the container into /data/, The /data/ directory will be automatically created once you execute the command. The last part of the command says that I want to execute tandem and that the input.xml file is located in the /data/ directory.
It is imperative that you include into your xml files the /data/ path, do not use the tpp_root/ path, otherwise the TPP software will not find any of your files.
If everything goes well you should see the initial output from the analysis on your screen. Now you can continue the pipeline following the same basic ideas I showed.
If you got interested in how Docker works and want to use other bioinformatics applications I suggest you to take a look on the BioDocker website. I'm continually containerizing new bioinformatics software and you are welcome to join in and help. If you need some software inside a container and don't know how to do it, I'm also glad to help, just send an e-mail.
[1] Leprevost Fda V, Barbosa VC, Francisco EL, Perez-Riverol Y and Carvalho PC. On best practices in the development of bioinformatics software. Front Genet. 2014 Jul 2;5:199. doi: 10.3389/fgene.2014.00199. eCollection 2014.
↧